Italy is in trouble. Or more precisely, the country has been “abandonned by growth”. It is one of the few OECD countries that is unable to recover from the “2008 crisis”: its GDP is still lagging below 2007 levels. Would it be the simple result of the unability of the successive governments to make the “appropriate reforms”? It might well be that the explanation lies in something much more different, but much more unpleasant: physics.
First, statistics are unequivocal on the fact that growth has vanished, so far.
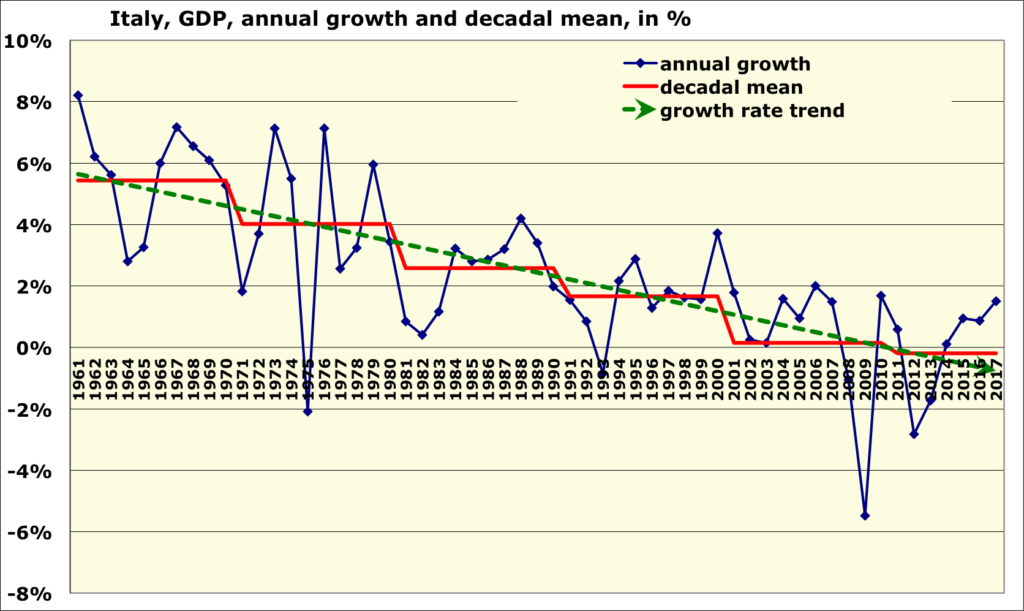
Year on year change of the GDP in Italy (or “annual growth rate”) since 1961 (blue curve), average per decade (red curve), and trend on the growth rate (green dotted line). It is easy to see that each decade has been less “successful” than the previous one since the beginning of this series, and that the decade that started in 2010 has an average growth rate which is… negative. Italy has therefore been in recession, “on average”, for the last 7 years.
Primary data from World Bank.
As the two are generally linked in Western countries, the debt on GDP ratio has risen to heights, botbh for public and private debt.
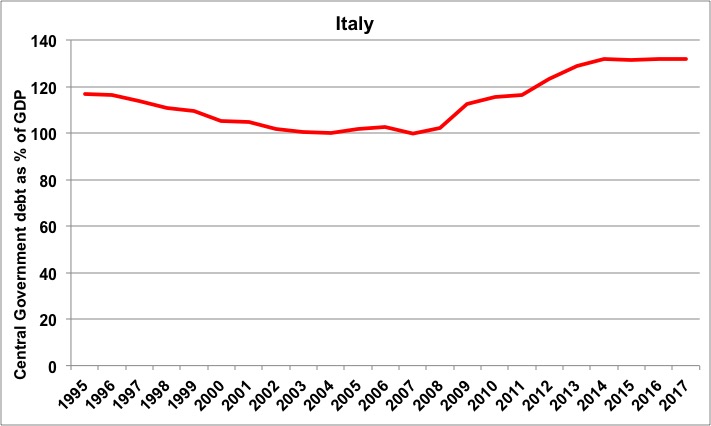
Debt on GDP ratio in Italy since 1995. Primary data from Eurostat.
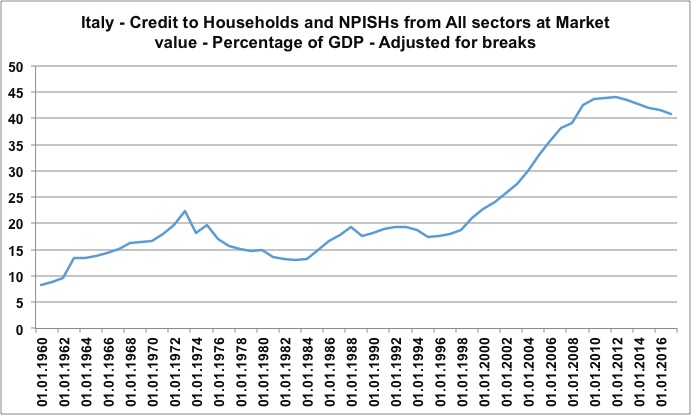
Households debt on GDP ratio since 1960. Data from Bank for International Settlements.
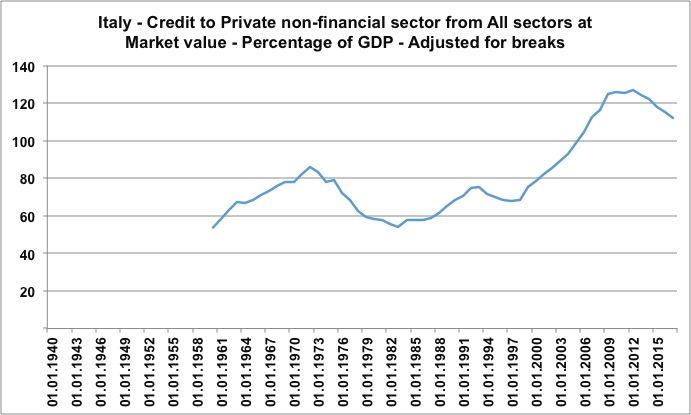
Credit to the non financial sector on GDP ratio (corporates and households) for Italy. Data from Bank for International Settlements.
All this would not be so annoying – well, from an economic point of view – if growth were to resume, because then the money to repay all this extra debt would be available. But why doesn’t growth come back? Some say that this is due to the lack of reforms. This is due to the lack of reforms, but not the same (reforms), say others.
But what if the true reason is… the lack of energy? In Italy, as elsewhere, the machines that surround us everywhere (rolling mills, chemical plants, trains, fridges, elevators, trucks, cars, planes, stamping presses, drawers, extruders, tractors, pumps, cranes…) have 500 to 1000 times the power of the muscles of the population.
It’s these machines that produce, not men. Today, homes, cars, shirts, vacuum cleaners, fridges, chairs, glasses, cups, scissors, shampoo, books, frozen dishes, and all the other tens of thousands of products that you benefit from are produced by machines. If these machines lack energy, they operate less, production decreases, and so does the monetary counterpart of this production, that is the GDP. And it is probably what happened in our southern neighbor.
First of all, energy is definitely less abundant in Italy today than it was 10 years ago.
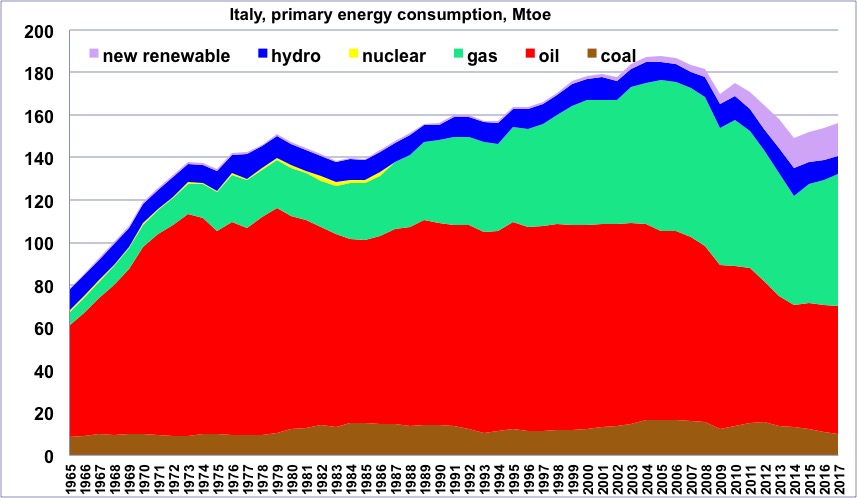
Primary energy used in Italy (sometimes called “primary energy consumption”; “primary” refers to the fact that it is the energy extracted from the environment in its raw form – raw coal, crude oil, crude gas, etc, not processed fuels or electricity that come out of the energy industries: refined fuels, electricity, processed gas, etc) since 1965. There was a maximum in 2005, i.e. 3 years before the fall of Lehman Brothers. It is impossible to attribute the decline in consumption to a crisis caused by the bankers’ negligence!
It is interesting to note that maximum of the energy consumption in Italy corresponds to the maximum gas production of Algeria (2005), Italy’s second largest gas supplier after Russia.
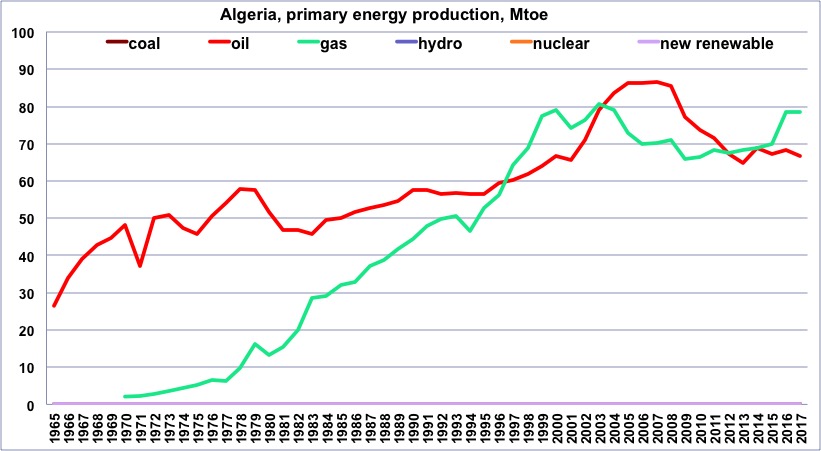
Oil and gas production in Algeria since 1965 (oil) and 1970 (gas). Oil production peaked in 2008, and gas production in 2003 so far (monthly data from the Energy Information Agency suggest that the gas production in Algeria is anew on the decline). Primary data from BP Statistical Review.
Italy is a major consumer of gas, because its electricity production relies on it for half of the domestic generation. This maximum (of energy consumption in Italy) also corresponds to the beginning of the stabilization of world oil production that took place between 2005 and 2010, which also led to a decrease in Italy’s import capacity in this precious liquid.
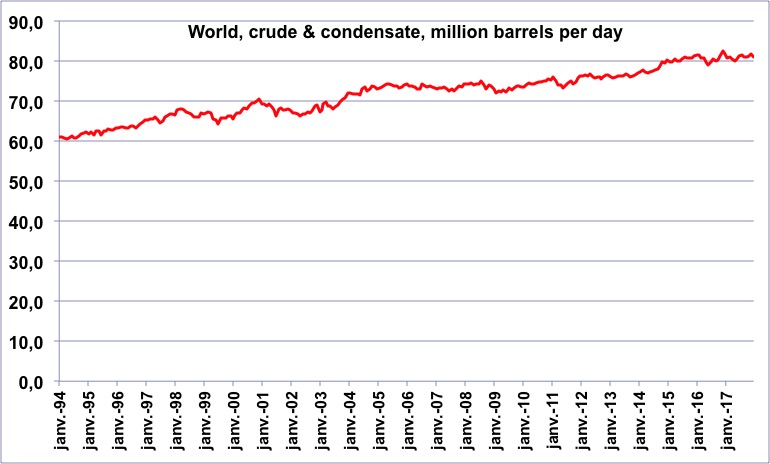
Monthly production of liquids (crude oil and condensates) worldwide. Data from the Energy Information Agency. We can clearly see the “plateau” that runs from 2005 to 2010, before the rise of the American shale oil, which has rekindled global growth and allowed the subsequent economic “rebound”.
Combined together, oil and gas accounted for 85% of Italian energy in 2005 (and accounted for 65% of its electricity production): less oil available on the world market (because a constant production must be shared with a growing importation from the emerging countries), and less gas available in Europe and Algeria led to a decline in supply before the beginning of the financial crisis.
In fact, when looking at trends over long periods, we can see that, in Italy as in all industrialized countries, i. e. with machines that produce instead of men, GDP is driven by available energy.
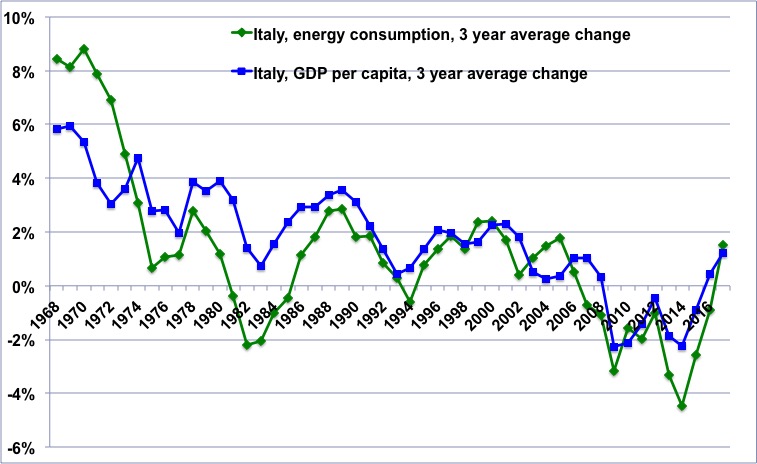
Rate of change (3 year running average) of the energy consumption in Italy (green curve) and rate of change (also 3 year running average) of the Italian GDP. It is noteworthy that the trend is the same for both. Where’s the hen, where’s the egg? For what follows, we just need one valid rule: less energy means less running machines and thus less GDP. And we see that when the energy growth slower, so does the GDP, one to two years later, which supports the idea that when it is energy that is constrained, GDP is forced to be constrained as well.
Data from BP Statistical Review for energy and World Bank for GDP
This “precedence” of energy over GDP will show up in another presentation of the same data.
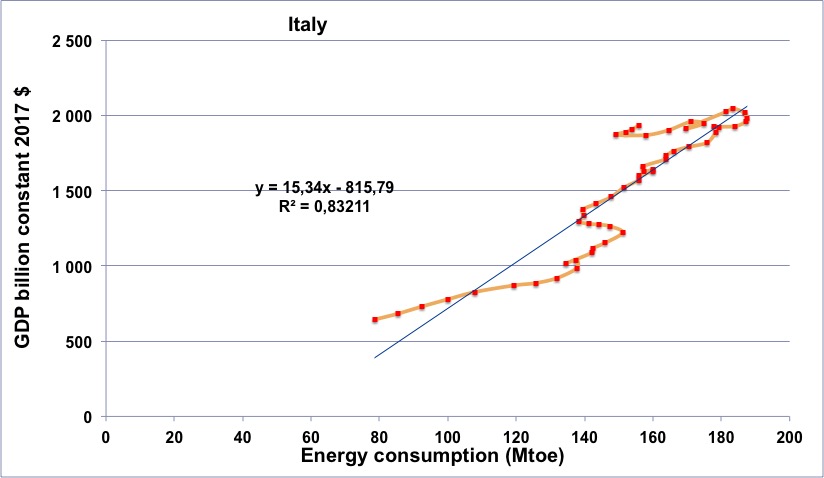
Energy used in Italy (horizontal axis) vs. Italian GDP (in constant billions dollars) for the period 1965 to 2017. The curve start in 1965, at the bottom left, and then follows the chronological order upwards to the right
We note that the curve makes a series of “turns to the left” in 1974, 1979, and especially from 2005 onwards. The “turn on the left” means that it is first the energy that decreases, and then the GDP, excluding in fact a sequence that would explain the decrease in the energy consumed by the crisis alone (then the curve should “turn right”).
One can also notice that after the decline in GDP from 2006 to 2014, the line goes back to “normal”, that is going from “bottom left” to “top right”, which reflects a GDP that grows again because of an energy supply that does the same.
Author’s calculation based on BP Statistical Review & World Bank data
And then?
Well, for the moment energy supply is going downwards, but will it continue to do so in the future? For the first 3 components of the energy supply in Italy, things look pretty settled. For coal, all is imported. This fuel is a nightmare regarding logistics: a 1 GW power plant requires between 4000 and 10000 tonnes of coal per day, and this explains why when a country is not a coal producer its coal imports are never massive. Add on top that coal is clearly the first “climate ennemy” to shoot: calling massively on imported coal to compensate for the decline of the rest seems very unprobable.
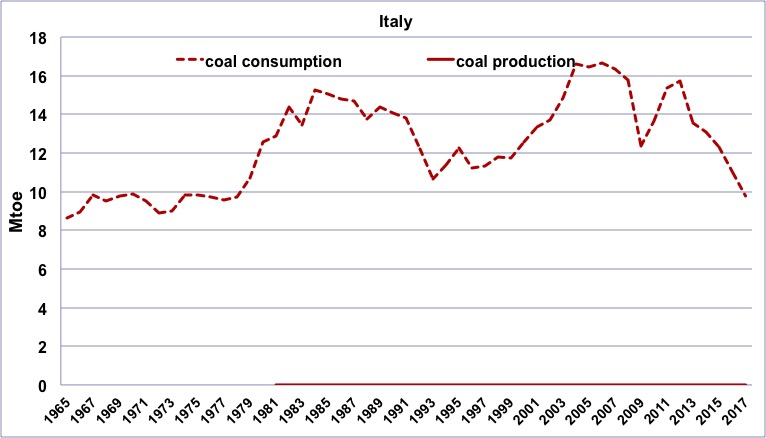
Consumption (dotted lines) and production (solid line, actually zero all the time!) of coal in Italy. Data from BP Statistical Review.
Then comes oil. Italy imports almost all it uses, and when world production stopped growing in 2005, Italian consumption fell in a forced way – as in all OECD countries – because the emerging countries took an increasing share.
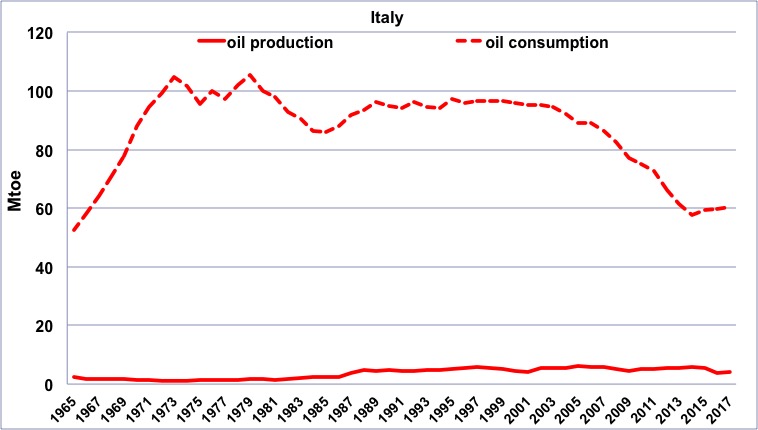
Consumption (dotted lines) and production (solid line) of oil in Italy. Data from BP Statistical Review.
Eventually comes gas. Here too, Italy had to reduce its consumption in a compulsory way after 2005, when Algerian production – which provides about a third of Italian consumption – peaked.
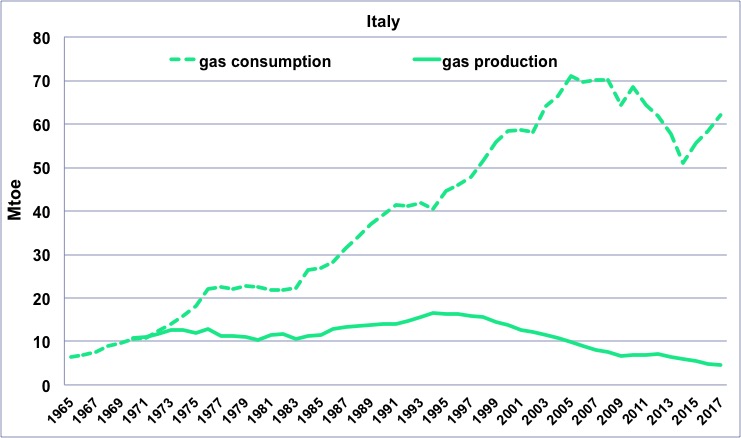
Consumption (dotted lines) and production (solid line) of gas in Italy. Data from BP Statistical Review.
Italy gave up nuclear power after Chernobyl, and so no “relief” can come from this technology. Hydroelectricity has been at its peak for decades, with all or most of the equippable sites having been equipped. In addition, the drying up of the Mediterranean basin due to climate change should also reduce rather than increase this production.
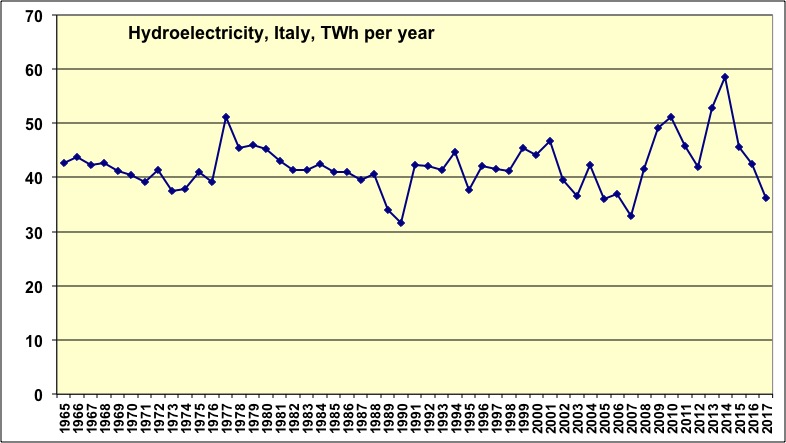
Hydroelectric production in Italy since 1965, in TWh (billion kWh) electricity. Data from BP Statistical Review.
Then remain the “new renewable”, mostly solar, biomass and wind energy, that now represent about the equivalent of hydropower. But solar and wind require a lot of capital to be deployed, and thus the irony is that if the economy “suffers” because of a decline in the supply of fossil fuels, there is fewer money to invest in this supply! Biomass requires a lot of land to become significant because of the biomass that has to be grown.
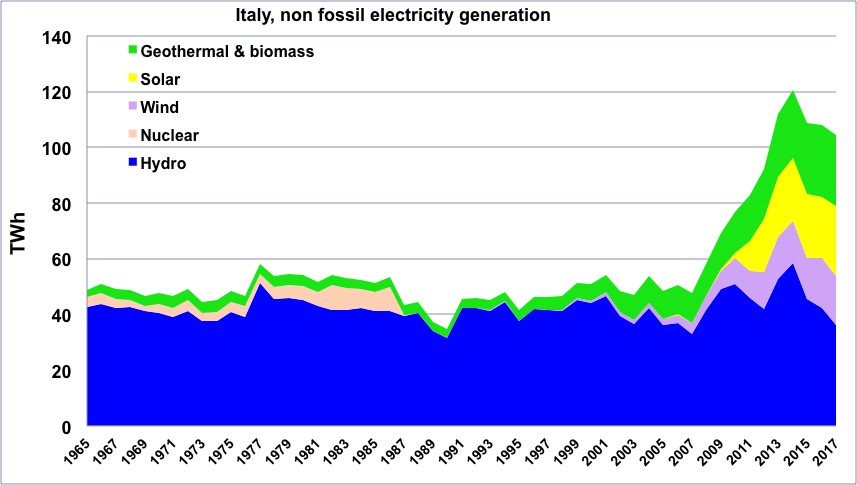
Non-fossil electricity production in Italy since 1965. We see that the “new renewable” (biomass, wind, solar) do a little more than hydroelectricity, i.e. 20% of the total production (of electricity only, of course). Data from BP Statistical Review.
As these means cannot quickly supply large extra quantities of electricity, and will quickly be limited by storage issues, the energy used in Italy remains massively fossil, and will do so in the short term.
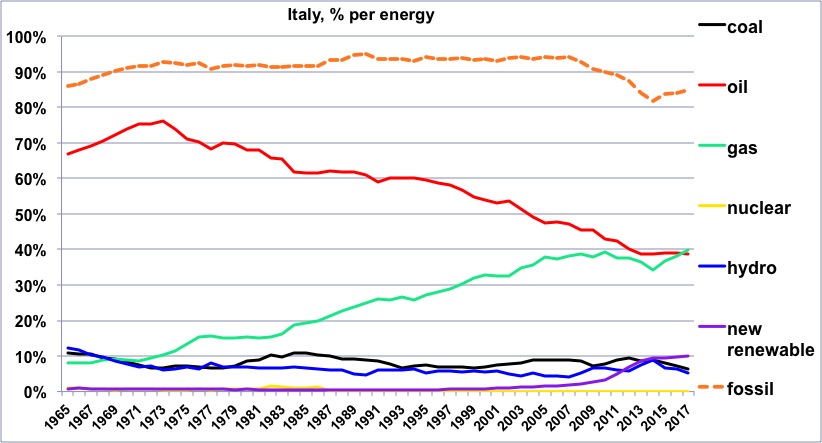
Share of each energy in Italian consumption. Data from BP Statistical Review.
It is therefore likely that Italy will remain massively dependent on fossils fuels in the next 10 to 20 years, and since the supply of these fuels is likely to continue to decrease on average, which means that Italy will have to manage its destiny without a return to growth, or even with a structural recession.
It is to this conclusion that a “physical” reading of the economy leads. And what is happening to our neighbours to the south is, most probably, the “normal” way in which an industrialized country reacts to the beginning of an unexpected energy contraction (and then populists follow, because of promises that coldn’t be fulfiled). As other European countries do not anticipate any better their upcoming energy contraction (that will happen anyway because oil, gas and coal are not renewable), let us look carefully at what is happening in this country. Something similar is likely to happen in France (and in Europe, and in the OECD) too if we do not seriously address the issue of fossil fuels, or more precisely if we do not seriously begin to organise society with less and less fossil fuels, including if it means less and less GDP.