Why on Earth should we bother about methane, to start with ?
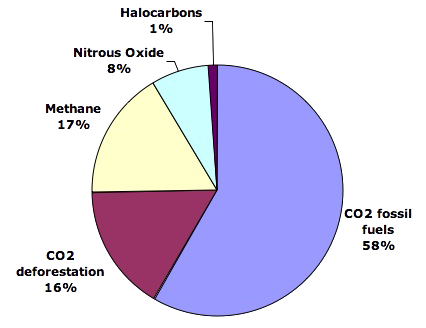
Even though attention is mostly drawn on the sole CO2 when greenhouse gases are discussed, it is a fact that this famous CO2 is not the only of these gases to be put in the atmosphere because of us: a rough quarter of our emissions is composed of “something else”, and among this “something else” a good half is composed of methane.
Well methane, just as CO2, is also a “natural” greenhouse gas, meaning that, with or without men, there is methane in the atmosphere. What we have done, during the past two centuries, is not to have put methane in the atmosphere that did not have any, but greatly increased the amount of atmospheric methane that previously existed.
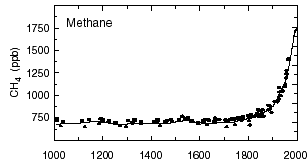
Atmospheric concentration of methane since the year 1000, in parts per billion (one part per billion = one millilitre for 1000 m3).
Source : IPCC
If we say that there was methane in the atmosphere before the “modern” human activities began to pour some more, we then must conclude that there are “natural” sources of this gas. And if there are such sources, it is then legitimate to ask oneself whether an uprising climate change couldn’t increase the “natural” methane emissions, just as it might be the case with the CO2. Incidentally, if the atmospheric methane concentration was stable before men changed the situation, it also means that there are natural ways to eliminate this gas from the air, otherwise the natural sources would induce an everising atmospheric concentration, which is obviously not happening !
One might then also ask a similar question regarding the possible influence of a growing climate change on the natural sinks of atmospheric methane: does it reinforce or weaken this elimination process, or is neutral ? We might begin by the last question, because the answer is the easiest: a modified climate will not change much the slow oxidization of methane in the air, which is the way it is removed from the atmosphere.
Where does the “natural” methane come from, and how does it lead to hydrates ?
In order to get some methane, which is composed of carbon and hydrogen only (its precise formula is CH4, but it is a secret), we must have an organic compound (a plant or animal remain) that decays whithout being exposed to the atmospheric oxygen, and follows a series of reactions allowed or helped by the presence of bacteria. Indeed, if oxygen wanders around, the carbon and hydrogen atoms feel such an envy to mix up with it (chemistry is torrid, sometimes, I tell you) that we mostly get carbon dioxide and water, and not hydrocarbons, the vast family to which methane belongs.
Quite logically, the “natural” places where it is possible to keep organic remains from the oxygen in the air are under water and below the ground. A first place that corresponds to these specifications is a swamp, because the remains of the plants that grew above water fall below after the plants die, and decay in an anaerobic (without air) place. And over geological periods the atmospheric methane concentration is a good marker of the global amount of precipitations on Earth, because wet zones are more extended when rainfalls are more important in average. As a wetter climate is also a hotter climate (because more rainfalls means more evaporation, and more evaporation means a higher temperature over the oceans on average), it is quite logical to observe in ice cores that the methane concentration has been evolving as the global temperature for the last hundred thousand years.
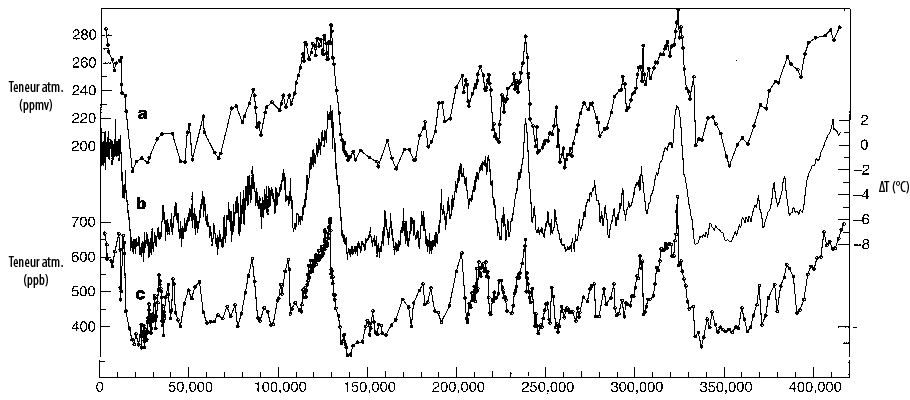
Compared evolutions, over the last 400.000 years (except for the last century, not represented) :
- of the CO2 atmospheric concentration, in parts per million – in short ppmv (upper curve, scale on the upper part of the left vertical axis)
- of the methane (CH4) atmospheric concentration, in parts per billion (lower curve, scale on the lower part of the left vertical axis)
- of the difference between the average surface temperature over Antarctica compared to present (middle curve, scale on the right vertical axis, but is a good marker of the average temperature for the whole planet).
The ice ages correspond to low temperature and CO2 values, and the interglacial ages (like the one we are in right now) correspond to high temperature and CO2 values. Note that between an ice age and a “warm period” the CO2 concentration changes by only 80 ppmv (what is exactely the extra concentration we have just added in a century).
Source : Petit & al., Nature, 1999
But the formation of methane is not restricted to swamps: the sediments below the ocean floor and the underground are also potential methane sources, if some organic remains happen to get there, as there is no oxygen, but there are bacteria, that live about everywhere on earth. Once “naturally” formed, this methane might, or not, go rapidly inn the atmosphere, depending on its place of formation. If it originates from a swamp, it will of course instantly go into the air (what explains that the amount of methane in the air is a good marker of the extension of wet zones), but for other sources the newly formed methane might very well not migrate to the atmosphere at short notice: natural gas reservoirs are nothing else than “old” methane that never escaped from the Earth after its apparition in the underground.
Why should this gas remain underground as it will always try to migrate towards the surface because of the pressure it undergoes in the entrails of the Earth ? Its progression towards the surface might actually be stopped in a number of cases :
- if it is trapped by a “gasproof” layer (the trapped gas is then generally the gaseous part of an hydrocarbon reservoir, see oil and gas formation),
- if it meets water, heavy pressure, and a very cool temperature : the gas might then build up, if the concentration in water saturates, a mixed crystal composed of methane and water, that is named… a methane hydrate. It looks just like regular ice, except it is ice that burns !
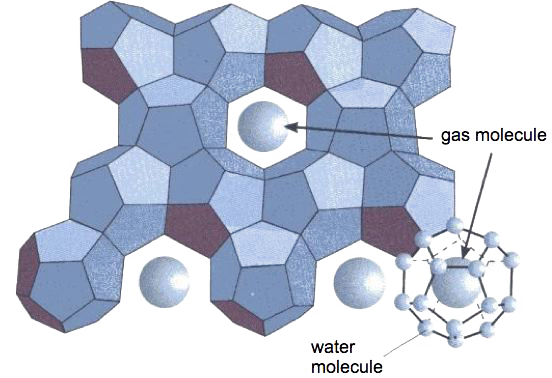
Schematic description of one of the possible gas hydrates.
The water molecules build up an ice crystal (a solid structure, then) composed of regular dodecaedres, and each dodecaedre traps a gas molecule. If the gas held prisonner is methane, it represents about 20% of the total weight.
The shape of the “box” – made of water molecules – that keeps the gas trapped might be slightly different if the gas molecule is larger (ethane, butane, etc).
This transformation process of methane and water into hydrates might in particular happen:
- under the permanently frozen soil of the high latitudes, named permafrost,
- below the oceanic sediments.
Under the permafrost, the zone where hydrates might be found constitutes a layer that “starts” 200 or 300 m below the surface.
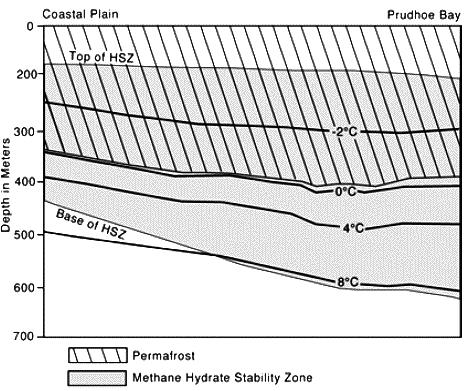
Example of a potentially hydrate-rich zone under the permafrost. HSZ means “Hydrate Stability Zone” ; it represents the zone where temperature and presure conditions allow the presence of hydrates (see details below).
The fact that the temperature increases when going down is normal, as a result of the geothermal heat.
Source : M. D. Max, Hydrate ressource for planetary habitation, 2001
But most of the methane trapped below the earth’s surface seems to be enclosed in the oceanic sediments (if we except the natural gas reservoirs, of course !). This methane results, as always, from the decay of animal and vegetal remains (mostly phytoplankton and zooplankton) that fall on the ocean floor, where they get covered by mineral precipitations (for example the shell debris of the plankton) then drafted towards the entrails of the Earth (see details on oil and gas formation).
How much hydrates below our feet (and beneath the dolphin’s fins) ?
Now that we know what methane hydrates are, and how they are formed, then comes the question on the global amount of this compound in Earth, because it is only from the answer to this last question that we will be able to discuss the risks associated to a massive release in the atmosphere. Well, answering this interesting question is all but simple. A first thing that we might do in order to get a clearer view is to “eliminate” all places where it is not possible to find hydrates, or not much, because one of the ingredients of the recipe is not available:
- there cannot be hydrates if the pressure is too low, what excludes shallow waters, and in particular most continental shelves, except near the polar regions:
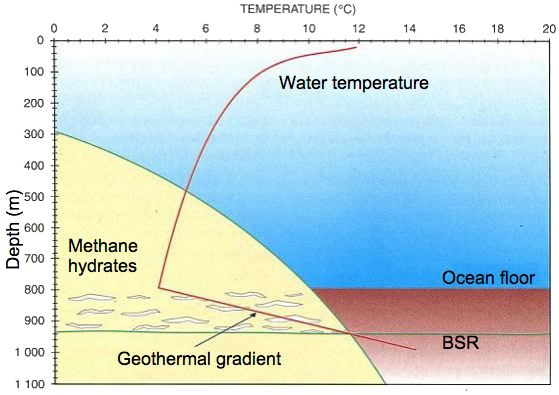
This graph allows to explain what are the zones where it is a priori possible (or impossible) to find hydrates. The indications represented on this figure are the following:
- the red line labelled “geothermal gradient” represents the average water temperature below the surface at mid-latitudes (actually, whatever the surface temperature is, the water temperature several hundred meters below the surface is about the same everywhere on Earth, more or less a couple degrees Celsius), then of the first hundred meters of sediment. The upper horizontal axis gives the temperature, the left vertical axis the approximate depth. At first the temperature decrease when going downwards, actually as long as we remain in the water (because less and less sunlight reaches the water), then increases when going deeper into the oceanic sediment because of the geothermal heat, that poorly dissipates in a solid environment, thus allowing a significant temperature increase when going closer to the source.
- the potential stability zone for hydrates (yellow zone at the bottom left), bounded by a curve giving the maximum temperature alowing the presence of hydrates depending on the depth (that gives the pressure: each additional 10 m of water adds the equivalent of the atmospheric presure). For physical reasons (it’s thermodynamics !), it is impossible that hydrates exist on the right part of this curve, that can be read two ways, either by refering to the temperature (upper horizontal axis) or to depth left vertical axis). For example, for a 4 °C temperature, hydrates might be found below 450 m of water, but not above because there is not enought pressure to allow the buildup of this crystal (in other words here are no hydrates on Earth where the water temperature is above 4°C and the depth below 450 m). Read the “other way round”, this curve indicates that , below 800 m of water, hydrates might be found as long as the temperature remains below 10 °C, etc.
- As hydrates can remain only in the sediments (this compound is lighter than water, thus if it appears in free water or migrates there, it will be pushed up to the ocean surface and disintegrate), they can be found between the oceanic floor, and the depth where the temperature has increased enough so that we go out of the “hydrate stability zone”. It is what happens at the depth where the red “gradient” curve intersects with the curve bounding the yellow zone. The inferior limit of hydrates, when performing seismic analysis, generates a particular backscatter that looks like that of he ocean floor, which explains the acronym BSR, for Bottom Simulating Seismic Reflexion.
Source : USGS, 2005
- There cannot be hydrates below very deep waters, because, apart from a few exceptions, there is not enough plankton in the deep ocean, hence too little organic matter falling to the ocean floor, and thus no methane generation in the sediment. Well methane must have saturated the water in which it dissolves in order to see hydrates appearing.
As a result of what is mentionned above, hydrates are supposed to be mostly present within continental slopes, that go from the continental margins to the abysses, and where the water depth is of several hundred metres, except for polar regions where hydrates might also be found within continental margins (but still a couple hundred metres of water depth is required).
When it is supposed that methane hydrates might be found somewhere, how can we be sure and possibly quantify the amount lying there ? The first technique, not very precise but useful to scan a large zone, is the seismic analysis. Indeed, hydrates have a conductivity of sound much higher than that of the “ordinary” sediment, so that when the sediment layer includes a significant amount of hydrates it produces a weaker echo than “ordinary” sediment. In addition, the bottom of this zone (which is the bottom of the hydrate stability zone, because of the heat produced by the Earth entrails, as explained above) generates a very specific echo that looks much like that of the ocean floor.
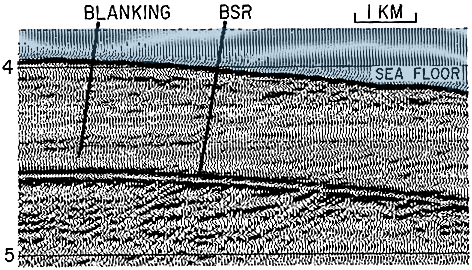
Example of echo obtained with a seismic analysis of the ocean floor where hydrates are suspected to be found.
Two “borders” generate a pretty similar backscatter: the sea floor, and the bottom of the hydrate stability zone (BSR, for Bottom Simulating Seismic Reflexion). The figures on the left give the number of seconds that happen between the sending of the signal and the reception of the echo.
Source : USGS, 2005
Then, when seismic analysis has allowed to spot a zone that might include hydrates, it is necessary to drill a hole (actually drill a core), as often in geology, to go further. The said hole, performed in the ocean sediment, has two usages :
- at first, it is of course the counterpart of the core brought to the surface. In this core, analysis will be performed to investigate the presence – or the past presence – of hydrates. But “hydratologists” have a serious handicap compared to all their collegues that make holes for other purposes in the botton of the ocean. Indeed, for most drillings, what is brought on the ship is identical to what has been sampled from the floor. For hydrates, tough luck ! As the pressure lowers when the sediment is brought upwards, the hydrate is no longuer in its stability zone and partially dissociates. As a result, what is seen in the core brought up is not identical to what has been sampled, and it not even easy to know “how much different” was the core when it was at the bottom of the ocean compared to what now lays on the ship deck !
- the resulting hole is then used – it might be simultaneous with the drilling – to insert various instruments, to measure the resistivity of the sediment, the infrared emissions of the same sediment, and other analyses that will yield precious indications to know whether hydrates are present in the sediment, even though they have partially vanished from the core examined on the ship.
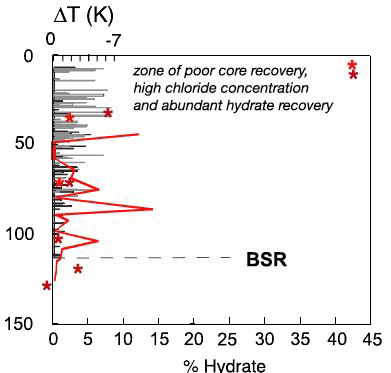
Example of analyses performed by various instruments inserted into the core hole, or on the core brought back.
The left vertical axis gives the depth, in metres, below the ocean floor. BSR means Bottom Simulating Seismic Reflexion.
- Red stars indicate the amount of hydrates found in the sediment uplifted by the core driller (which is a special device that “brings everything up” in an airtight tube) ; lthe scale is given by the bottom horizontal axis,
- the grey bars give the temperature anomalies measured by an infrared camera, because a local cooling is associated with an hydrate dissociation (upper scale, K = kelvin),
- the red line represents the chloride concentration in the water enclosed in the sediment pores, which is a marker of the presence of hydrates: when hydrate crystals are formed, some chloride is expelled in the water.
Source : Anne Tréhu et al., Joides Journal, 2003
As we see, even after drilling lots of holes, knowing exactely how much hydrates are enclosed in what is sampled is not necessarily trivial. In addition, cores alone offer a limited view in any analysis of solid matter: it is very easy to witness a major change in the concentration when moving just a few kilometers away. It is the case for most ores, for a coal seam, or even… for the carbon fraction of a soil (that can vary tenfold whithin less than a kilometre in the Fontainebleau forest !).
The way to proceed for compounds dissolved in liquids (I make a couple samplings here and there, then extrapolate to all the fluid) is thus not valid to give even a rough figure when a solid compound is included in another solid compound, because there is no more guaranty of homogeneity any more. This being said, drillings, even with all their limitations, are nevertheless indispensable, because they represent the only way to “go and see”, and will allow to calibrate the seismic analysis, that allow to scan larger zones.
All the above lead to the conclusion that, in order to obtain a precise idea of the amount of hydrates that exist in the ocean floor, we should drill every 10 meters over the whole planet, with a drilling machine that doesn’t let anything escape when the sediment is brought back onboard. As these advanced drilling machines have been used in 2002 for the first time, the reader will easily get to the conclusion that this way to proceed would not yield results tomorrow !
The figures published on the global amount of hydrates on Earth are thus obtained with partial experimental results, and must be considered very cautiously. As the proportion if hydrates in the sediments that enclose some can greatly vary, from a couple %, scattered under the form of small inclusions several mm wide (most frequent case), to an astounding several tens %, in some particular accretion places, it is easy to understand that the hypothesis choosen for the average proportion of hydrates in the sediment can lead to a result varying tenfold !
A first possible synthesis of the available information is simply to draw a map of the places where hydrates have been sampled, or are most probably there given the results of the seismic analysis (below).
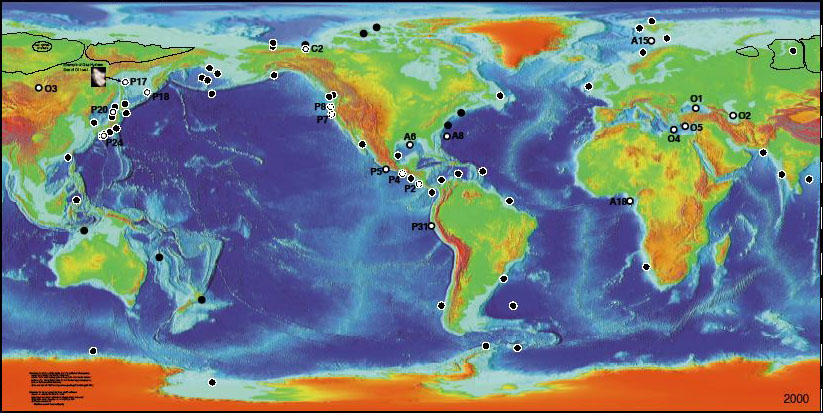
Regions of the world where hydrates have been sampled (white circles) or are supposed to be in the light of seismic analysis or core holes analysis (black circles).
Source Keith A. Kvenvolden and Thomas D. Lorenson, USGS, 2000
From the available information, some USGS (US Geologic Survey) researchers have evaluated that the terrestrial stock of hydrates amounts to 10.000 billion tonnes of carbon (carbon represents 12/16è – that is 3 fourths – of the total weight of methane), or the equivalent of twice the cumulated extractible amounts of gas, oil and coal for the whole planet. Once again, this is a result to be taken cautiously, and if this might justify an additional worry regarding the climate, as we are about to see, nothing indicates that whatever significant portion of these hydrates will be mineable in the foreseeable future.
Why is all this a problem for the climate ?
As the methane is a greenhouse gas, and as it is the main component of natural gas (and thus that it burns !), there are two scenarios resulting from the presence of hydrates that might be a major source of worry:
- if these hydrates are commercially viable, humanity will be very tempted to use them as a new source of energy to face the depletion of the other ones, such as oil, and using these hydrates as an energy source will prolongate the possibility of rising CO2 emissions (actually some very CO2 intensive emission scenarios suppose that hydrates become commercially exploited),
- whether these hydrates are commercially viable or not, if the layer where they remain warms up, they will not be stable any more, hence will dissociate, and the methane will escape to the atmosphere, then feeding an accelerated climate change, since methane is a greenhouse gas.
The first hypothesis implies – once again ! – that these hydrates will be commercially viable someday. If their average concentration in the sediment is not greater than several %, nothing is less certain, because it is not given for granted that someone will find someday a way to extract from a solid surrounding (the oceanic sediment) a compound that contitutes only a couple of % of it while spending less energy to do so than the energy enclosed in the methane gathered.
Let’s suppose, still, that there are enough places where hydrates are concentrated enough so that a large fraction of these hydrates might be used as an energy source. Is it possible to give an upper limit to the additional emissions that would result from this ? If the global amount of hydrates is of several billion tonnes of carbon (that’s a first hypothesis), and if several tens % are extractible (that’s a second hypothesis), we are facing here a resource about the same importance than coal. Well, with coal alone we are already endowed with more than enough to provoke a massive climate shock, and wisdom definitely suggests to leave most of it (most of coal, of course !) below the ground, if we except sequestration possibilities. Putting hydrates on top of coal, because the latter would be too depleted, is probably signing for a temperature increase of more than 10°C in less than two centuries. Would it be only possible without the first consequences of a massive climate change “calming us” first ?
But even if we let them underground (or undersea !), still, we cannot forget these hydrates. Indeed, the planetary warming that we have put in motion , and that will increase in the future whatever we do (but more or less depending on our future emissions, still !) will also propagate towards the ocean floor, very slowly for sure, but the ultimate outcome is a warming nevertheless. When the temperature increase has propagated to the hydrate stability zone (a century or more will be required, still), part of these hydrates might disintegrate, and free the methane that will go into the atmosphere.
The melting of the permafrost, at last, might also lead the continents to become methane sources : the propagation of the warming downwards in the permafrost could also disintegrate part of the hydrates enclosed in the deep artic underground. The higher end of the bracket for the possible temperature increase resulting for the freeing of methane enclosed in the hydrates is probably over 5 °C, on top, of course, of the several degrees that would result from the direct emissions of humanity, and on top, also, of the extra warming that would result from a fast unstoring of the soil carbon.
Of course, this is not for tomorrow. But how can we be sure that it is not for after-tomorrow if we try to prolongate the trends as long as we can ?
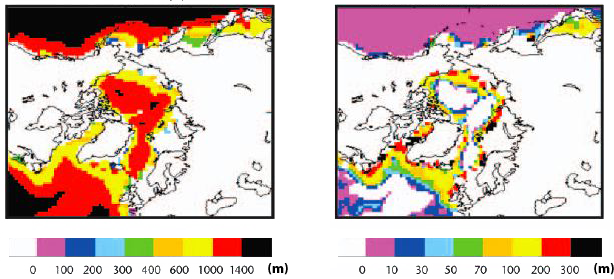
Simulated thickness of the layer potentially enclosing hydrates in the sediment with the 1870 climate (left image) and thickness of the same layer for the simulated climate of the year 2100.
The region represented on the map is the surroundings of the North Pole (which is more or less in the centre of the picture): one will spot Canada on the left and Russia (Siberia) on the right. The emission scenario is not given in the document presenting this result. And the thickness scale is not the same for the two pictures, though the colors used are the same !
Source : Stabilising climate to avoid dangerous climate change – a summary of relevant research at the Hadley Centre, Hadley Centre, 2005
