A quick intro
Ever since our perception of fossil fuels switched from being a blessing (for they allowed most of the economic growth) to being a curse (because of climate change), a set of “100% renewable” scenarios have appeared on the radar screen. Generally nuclear is not present either in these scenarios – even though this energy doesn’t contribute to GHG emissions – because they are promoted by entities that dislike splitting atoms as much as they dislike oxidizing carbon.
Whether these scenarios deal with energy at large or just with electricity, they both assume that the latter has become 100% renewable. For electricity generation, the two dominant renewable energies in these scenarios are wind and solar.
A 100% renewable future, that’s a motto which is sure to get support from everyone. Or, to be more precise, everyone is in favor as long as “everything else remains the same”: we managed to get rid of fossil fuels, of nuclear power, and still no one lacks heating during the winter, nor lacks a car able to move oneself from home – where everything is “like before” to a working place – factory, office, or anything else – where everything is also “like before”. No train remains by the platform when it’s supposed to leave, no plane remains on the tarmac when it’s supposed to take off, no furniture or pair of glasses doesn’t get manufactured because the machinery remains still in the plant. And, of course, we don’t need to spend any extra buck to get to that ideal world. Who would be against that future?
When a story seems so appealing, how can anyone (apart from the promoter, of course) decide whether it has any chance to turn true, or will remain a fairy tale forever? That’s where we have a problem: in an hour, alas, no one can tell. These scenarios represent the output of a model that an outside observer is unable to analyze or validate without having spent hours (at least!) to investigate them thoroughly.
No one can tell, without spending the night (or almost), if these scenarios assume an availability of resources (such as metals of any kind to produce panels or wind turbines, grid elements or storage solutions) that can actually be fulfilled, or whether they assume that we should invest a massive portion of our GDP (which itself depends on available energy!) in rebuilding the electrical power system, or whether they imply that 60% of the population should be employed in the energy sector… preventing in turn those same people from doing anything else!
And that’s precisely the issue: without such a validation, and a kind of warranty that there is no major caveat, a scenario should hold no value for a policymaker, because the job of a policymaker is (normally) to take bets that have a chance to be successful. Among the counterparts that seem unavoidable, there is one which is “how much investment do we need to achieve the target?”.
It’s precisely the point of what follows, which is not about exposing a trajectory that will enable us to reach a 100% renewable electricity, but simply about figuring out how much money we would need to invest for that final result, and compare the amount with the total investment required to renew that French system “as is”. Why the French system? Because it provides a low carbon electricity mostly made of nuclear, and for that option we already have a reference (whereas a 100% renewable system based only on wind and solar + storage exists nowhere in the world for the time being).
Let’s say that it’s a small unpretentious calculation that aims to give a rough idea of the magnitude of the difference between two “fully low carbon” options, that still enables to draw major conclusions.
Where do we start from?
Our starting point is the present situation in France, where most of the production (3/4) comes from nuclear.
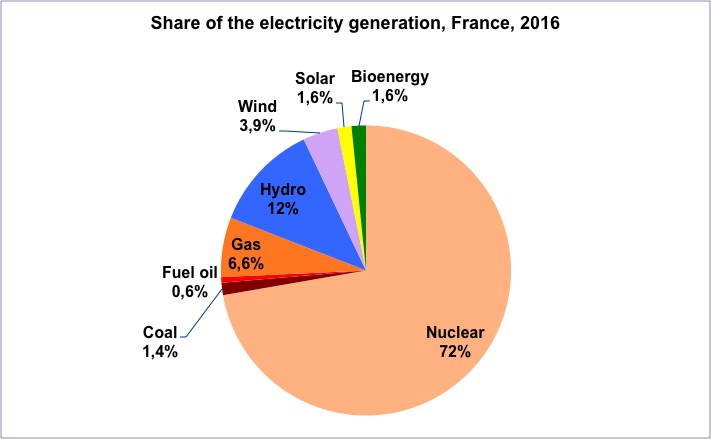
Breakdown of the electricity generation in France in 2016. The total mounts to 531 TWh (1 TWh = 1 billion kWh). Source: Réseau de Transport d’Electricité
However, nuclear power does not represent 3/4 of the installed capacity, but much less, because its “load factor”, that is the “fraction of the year at full power” is much higher than that of other means of production.
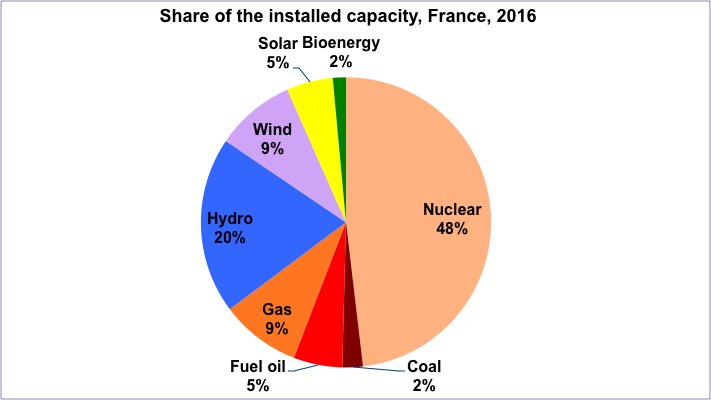
Breakdown of the installed capacity in France in 2016. Source: Réseau de Transport d’Electricité. The total amounts to 131 GW (1 GW = 1 million kW, and 1 kW is the power of an iron, or a little less than that of a dishwasher).
The production capacity is thus about 2 kW per capita in France. On the consumption side, though, the power of an ordinary domestic subscription – with 2.3 people per household on average – is closer to 6 kW, or about 3 kW per capita. If we add the installed power for industries, tertiary buildings, communities (lighting), transport (train and subway), common areas of residential buildings (elevators, lighting …), etc, we multiply that number by a factor 1.5 to 2.
This means that if everyone was “autonomous” regarding one’s electricity supply, scaled to one’s peak use, and with the ability to cover all current uses (including industry), it would probably triple the installed capacity (of dispatchable means) in the country.
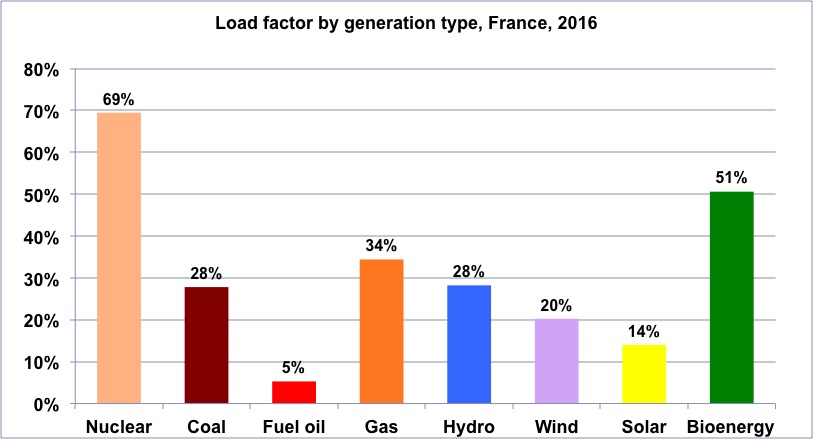
Load factors for each means used in France in 2016. This factor represents the “average percentage of the installed capacity used throughout the year”. For example, 5% for “fuel oil” means that at the end of the year this type of power plant will have produced just as if it had been used at 5% of its installed capacity all year round, or only 5% of the time at full capacity.
Similarly, for hydropower, the output at the end of the year is the same as if it were constantly set to produce at 28% of the installed capacity (nominal capacity is 25.8 GW at the end of 2016). Author’s calculations on RTE data.
We see that for solar, the load factor is 14%, and 20% for wind, respectively a fifth and a third of what it is for nuclear. However, these first two means produce “as much as they can”. As they have priority on the grid, their production can only drop (or stop) for one reason: not enough wind or sun. If the factor is low, it is not because we deliberately decide not to call on the capacity, but just because nature cannot provide more.
As the above graphs show, load factors vary greatly from one type of power plant to another. For solar it is limited because mother nature has decided that there would be no sun at night, and that there would be little in the winter and during rainy days. For wind turbines, the same mother nature decided that there would be no optimal wind permanently (there is often wind, but more or less strong…). Those capacities that produce only when external conditions allow it are said to be fatal: they produce whenever it’s possible, and therefore electricity is fully available at some times, partially at some other times, and on rare occasions not available at all, or almost.
But most of the production comes from so-called “controllable” means (they produce on demand). Some are running at full capacity almost all year round (run of river or nuclear), others are called only for a very small fraction of the year (fuel), but they are essential to ensure the stability of the grid at certain times, especially during the evening peak in winter (in France, that time corresponds to the maximum load on the grid). Of course, at that moment solar is at zero because it is at night, and if it is cold there is generally an anticyclone, and the wind is not strong.
These controllable means always include hydroelectricity, from dams (about 15 GW of capacity currently in France) or run of river, gas, oil and coal power plants.
But, as opposed to what is the case in most countries, in France nuclear power can also be used for load tracking, to follow demand even when it is rapidly changing.
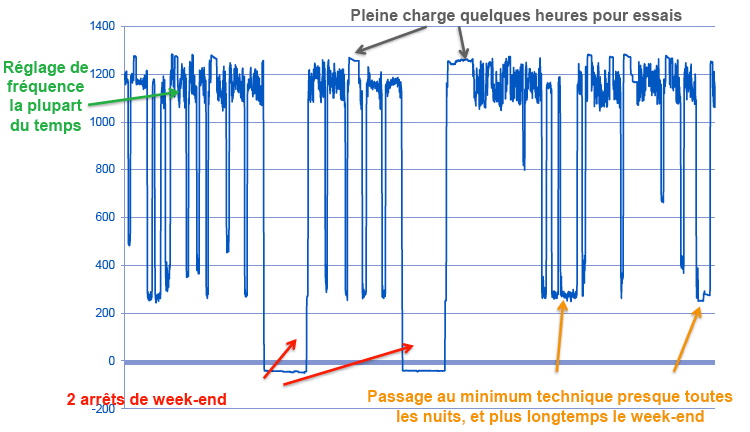
Output of the Golfech 2 nuclear reactor over a month. Source EDF
It is easy to see that the reactor is able to perform rapid changes of its output, both upwards and downwards. It can therefore easily adjust to the load curve (it is referred to as “load tracking”). Most French nuclear reactors can increase their output by 30 MW per minute, which is equivalent to what a regular gas-fired plant can do (a high-performance gas-fired plant can go up to 50 MW per minute).
The French nuclear fleet does not adapt its output only to daily changes: it also does so for seasonal changes. Nuclear energy provides half – or more – of the winter production surplus (it is therefore inaccurate to say, as it is often heard in France, that electric heating is supplied only with coal power plants that operate only in the winter).
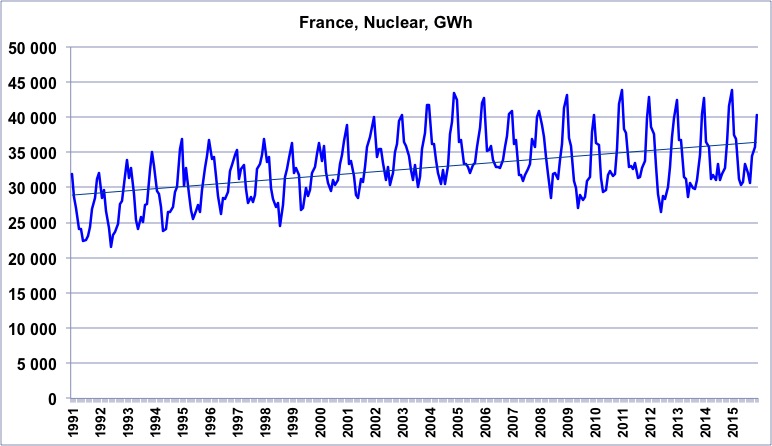
Monthly nuclear production in France, from January 1991 to December 2015. The seasonal surplus of nuclear power is clearly visible, and roughly represents 50 TWh for the whole year. Electric heating uses about 70 TWh per year (residential and commercial combined), but it is not the only usage that increases in the winter: it is also the case for lighting, because days are shorter, cooking, sanitary hot water, or even defrosting rails, and lots of other things.
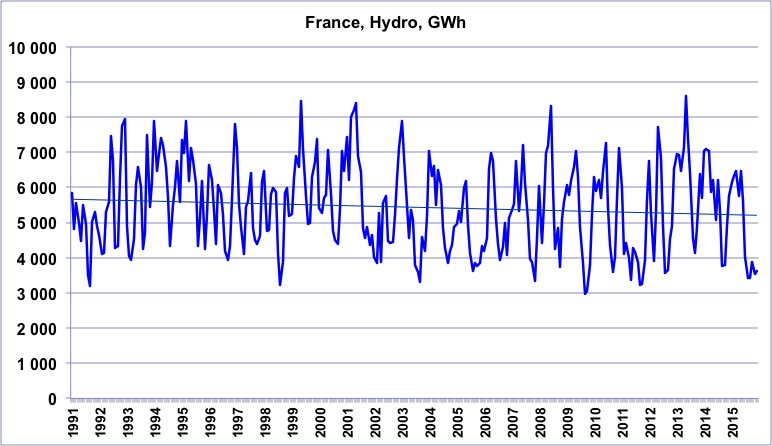
Another significant seasonal contributor is hydropower, what can be seen on the graph below (source ENTSOE for the data of both graphs).
And now let’s head for 100% RE
We will now compare this reference situation – the present one – with a target situation where we have only renewable electricity, provided fully by wind, or fully by solar (I know it’s caricatural, but it’s a start, and it’s not so bad to get orders of magnitude). As backing by gas or coal fired power plants is by hypothesis no longer possible (if we are 100% renewable, then there is no more gas or coal, by definition!), ensuring permanent balance between demand and supply, even when there is not enough wind (or sun) is provided with storage. In the calculation below, I have used the only large-scale storage solution currently available in power grids, that is reversible dams called pumping stations. An extra calculation with batteries is also provided.
Moreover, my country is supposed to be able to meet its needs at any time without imports. There is thus no “miracle exporter” elsewhere in Europe, that would provide extra electricity – also 100% carbon-free – exactly when we need it, without assuming the corresponding investments (this kind of “magic card” is present in a number of “100% renewable” scenarios, though, because it allows to avoid investments that are used a very small fraction of the time, but are necessary to prevent black-outs).
This hypothesis is logical given the European situation: it is dark almost everywhere at the same time, and it is winter everywhere at the same time (therefore there is no photovoltaic generation happening in the neighboring countries when there is none at home), and for wind meteorological observations show that when there is a depression – or not – over a given European country, conditions are close in the neighboring ones).
The name of the game is now to compute, in order of magnitude, the full cost of such a “self-sufficient” system, running only on wind and storage, or PV and storage. NB: in the beginning, I will assess two simple situations : wind only and storage, and solar only and storage. I will then assess a combination of the two.
In other words, we will try to find out how much investments are required to get there, and compare that amount with what is needed to rebuild the current French system (“fully nuclear”) from scratch. In economic terms, using this method has the following advantages:
- there is no need to provide a precise description of the path to follow for the transition. We just make explicit the counterpart, in terms of total investments, of the target situation. It is good enough to have a first opinion on the realism of such a plan, and therefore the relevance of “trying for real” (because if we conclude that the target situation requires out of reach investments, trying for real won’t provide the desired result…),
- as it is a “physics first” reasoning (we basically list all the items that have to be present for the system to operate), it encompasses by construction all the necessary investments. Conversely, when one extrapolates current microeconomic costs (LCOE, or Levelized Cost Of Electricity), without going through physics, one can (and most often will) “miss” investments that are useless with marginal intermittent productions, but become preponderant when these productions dominate.
- this approach does not count without saying on a flexibility that would be brought for free and without quantitative limit by the exchanges at the borders (whereas the microeconomic calculations cannot include this item into production costs, since it does not belong to the production process)
- similarly, this approach makes the storage costs explicit, as they are not covered by the producer, and therefore invisible in the LCOE.
As we will see, it turns out that the result we get is very close to what has been observed for the German transition.
How much power?
The first thing to do is to calculate the power to be installed in wind turbines or PV panels to produce the same amount of electricity, over a year, than the 63 GW of nuclear power we have in France.
With a load factor of ≈75%, these 63 GW of nuclear produce 63 (GW) * 8760 (hours in the year) * 75% (load factor) = 414 TWh in the year.
If we replace this nuclear with onshore wind only, which has a load factor of 15% to 25% depending on the location and the year, the power to install to obtain the same annual gross output would be 3 to 5 times more important. If we take a 20% average load factor (in Germany, this factor goes from 15% to 20% depending on the year according to BP Statistical Review), we need 236 GW of capacity (for the continuation we will round this up to 240).
With just solar panels, that have a load factor of about 10% in Germany, but 14% in France (in 2016), it is about 340 GW of capacity that should be installed for the same annual gross production.
What about the grid?
Replacing nuclear reactors by renewable energies therefore means that the overall installed power climbs from the present 110 GW (including 63 of nuclear) to 236 GW (wind) or 338 GW (solar), and actually even more when storage losses are taken into account, as we will see below. And the average production unit is much smaller than a conventional power plant. It means that a first set of significant investments is required into the distribution grid to connect all these “decentralized” units (that are generally connected to the low voltage part of the grid, under 20 kV, called the “distribution” grid). Indeed, it is much more expensive to install 500 lines of 100 MW each (magnitude of the nominal power of a set of wind turbines or a medium to large scale PV plant) than 20 cables of 2 GW each (magnitude of the nominal power of a nuclear reactor… or coal power plant): it requires much more materials, bulldozers and public works!
In addition, with a total production capacity multiplied by 2 to 3, it is also necessary to reinforce the transmission grid (the high voltage power lines, over 90 kV). Even if the maximum power of a collection of wind farms scattered over the country is never 100% of the total installed power, statistics show that it can go up to 70% or even more, and the grid must then be able to “evacuate” everything that is produced. With the above figures, and with wind turbines only, the French grid should be able to cope with a maximum power of 260 * 0.7 ≈ 200 GW, or twice as much as the maximum load in France (≈100 GW). With solar only it would even be 300 GW of peak power that the grid should be able to evacuate.
The data currently available on the cost of reinforcement of the grid shows that it is growing faster than the share of intermittent and fatal renewable electricity in overall production. With 15% of production coming from “wind + solar” in the electricity production, the reinforcement of the grid already requires to add at least 15% to the direct investment in production. In Germany, with a 20% share from intermittent and fatal sources, the production cost almost doubles.
If all the electricity production comes from wind or solar, it seems reasonable to consider that for 1 euro invested in production, it will take about one additional euro for investments in the “electrical environment” in the broad sense (connections to the grid, additional low and high voltage power lines, transformers).
There is no particular reason to believe that we would benefit from scale factors in such a case, because we would face a multiplication of small operations (trenches, cable laying, installation of transformers, etc.) performed by small and separate operational units, without much scale effects.
We must store!
We now have a production fully coming from intermittent and fatal means. But, in our modern societies, the pattern of consumption is marginally dependent on the presence of sun or wind: fridges depend on the temperature required, elevators on the number of floors of buildings, steel mills on the market demand, trains on schedules, heating on the external temperature, cooking on the hour in the day, washing on the presence at home, etc.
The load curve in a 100% RE world is thus supposed to remain mostly as it is today, because I have assumed that the global organization of a modern society is mostly alike. Another solution is to decide that there will be trains and TV at night only when is there is wind, but this assumes a totally different type of society, which is generally not in the mind of people advocating a 100% RE electricity generation.
The sun – by definition! – does not shine at night, and – in France – solar production is on average 4 or 5 times higher in July than in December or January. Likewise, the wind blows more in winter. But consumption takes place at night and day, in winter and summer, and the load does not vary by more than a factor 2 over the year. To keep a security of supply, it is therefore necessary to have storage facilities, able to ensure both daily storage but also inter-seasonal.
The available studies show that the required storage power (in GW) is a fraction of the production capacity (in GW), because storage must be activated when there is an excess electricity production. On the other hand, the storage capacity (in GWh) depends on the length of episodes of low wind and/or sun.
The present storage power in France – fully enclosed in pumping stations – is 5 GW (thus 5% of the installed production capacity), and the storage capacity – which comes from all the dam lakes combined – is 3.5 TWh (about 2 days of consumption).
We will make the assumption (probably excessive, but it allows to understand the orders of magnitude) that any excess kWh produced by a wind turbine when there is wind, or by a solar panel when there is sun, is recovered and stored.
The load in France can fall to 50 GW at the lowest point of the day (or rather the night) in winter, and to 30 GW in summer. If we recover all that is produced above what is consumed, it means that we must provide a storage power that is able to absorb the maximum difference possible between consumption and production. If we have a production fully provided by wind power, the maximum output of the installed base is 70% of the installed capacity, which is, with our calculation, 70% of 240 GW ≈ 200 GW. In a mild but windy winter night, with the consumption at the lowest, we must therefore install 200-50 ≈ 150 GW of storage power in order of magnitude.
If production is 100% solar, we must size the storage so that it can accommodate the difference between what is produced at noon on a sunny Sunday in July (340 GW) and what is consumed at the same time (about 30 GW), which leads to 300 GW in order of magnitude.
If we look now at the amount of electricity to store, we can start from the following observations:
- for wind turbines, 80% of the annual production comes from 50% of the most productive hours,
- for solar panels, 80% of the annual production comes from 20% of the most productive hours.
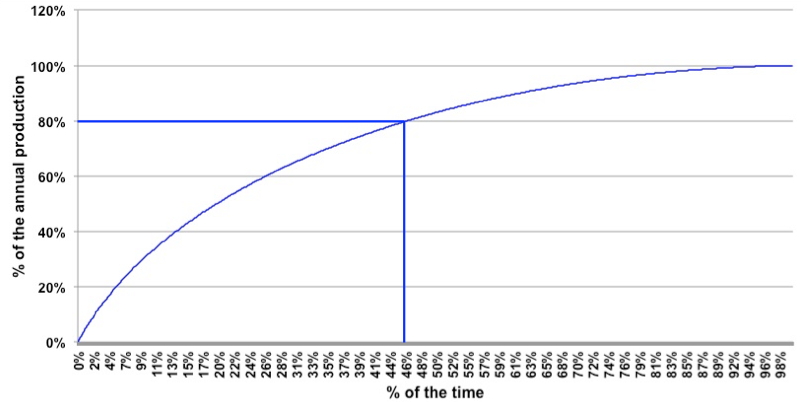
The above graph gives the fraction of the annual wind production in Germany corresponding to the 8760 hours of the year, ranked in descending order of production (from left to right). We can see that 80% of the annual production happens over a little less than 50% of the time (and 50% during 20% of the time). Symmetrically, the production is almost nil for 10% of the time, and negligible for 20% of the time.
In comparison, the load (in Germany) varies by “only” a factor 2 between the lowest value of the year and the highest value of the year.
Source of the data: Paul-Frederik Bach
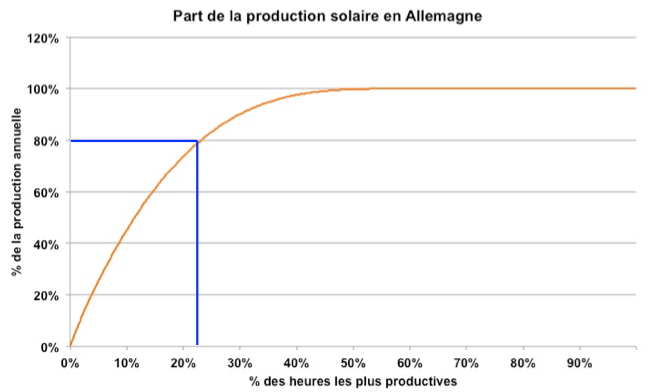
The above graph gives the fraction of the annual solar production in Germany when ranking the 8760 hours of the year in descending order of production (from left to right). 80% of the annual production happens during a little less than 25% of the time (and 60% during 15% of the time). Symetrically, the production is nil for 50% of the time.
Source of the data: Paul-Frederik Bach
We can therefore assume, on first approximation, that if all electricity production comes from wind turbines, 40% to half of the consumption – that is roughly 250 TWh in the case of France – will have to be stored for at least a day, and sometimes for a week or more. If we have a 100% solar production, it is then 80% of the consumption – that is roughly 400 TWh in the case of France – that will have to be stored for at least a day, and often for much more.
To store such an amount of electricity, the most economical option is to use pumping stations. This device consists of a normal dam, to which is added a downstream reservoir (so that the water, once turbined, remains available in another artificial lake), and a large pump able to lift the water back into the upstream reservoir. When there is an excess of electricity available on the network, this electricity is used to operate the pump that lifts the water (from the downstream reservoir) into the upstream reservoir. This water can then be again turbined downstream to produce electricity (and stored in the downstream reservoir after turbining).
France has about 5 GW of nominal power of pumping stations presently. We have seen above that the storage power should rise up to 150 GW if production is 100% wind, and 300 GW with a 100% solar production.
One of the options could be to build plenty of dams above Lake Geneva, so that the water from the lake can be pumped upwards when there is excess electricity. Another option would be to build dams in all the mountains that are close to a shore, and pump up sea water.
Of course, such a massive deployment of reversible dams will lead to the flooding of plenty of valleys, with freshwater or seawater. I do not include the associated “damage costs” in the calculations below, nor do I take into account the costs of expropriation, of guarding construction sites, etc.
If we stick to the construction cost, building a greenfield pumping station requires building both an upstream reservoir (a conventional “dam”), and a downstream reservoir that collects water after turbining (this downstream reservoir could be the sea or Lake Geneva). It also means installing a high-power pump to lift the water in the upstream reservoir when we have electricity to “store”.
In OECD countries, all this costs 5,000 to 6,000 euros per kW of pumping power, and the lifetime of the corresponding investment is roughly a century. But when we store, there is another effect that we have to take into account: compensating for losses. Indeed, converting electricity into water stored into a higher reservoir and back to electricity generates losses.
First, when going from the wind turbine to a pumping station, 4% of the electricity is lost into the grid (joule effect), and it climbs to 7% when the electricity comes from a solar panel (because the initial voltage is lower, and thus the losses due to voltage conversion – to the high voltage of the transportation network used between the panels and the pumping station – higher).
Then there are losses due to the pumping itself (because of the friction of water on the pipe), which amount to about 25% in existing installations. This percentage can go down to 20% in modern installations, but if the water travels tens or hundreds of km from the coast to the mountains, this % will be higher (some say 40% or more).
And then there are 15% of additional losses when the water in the upstream reservoir is converted again into electricity, with the regular turbines of the dam. A conservative 30% of the initial electricity is therefore lost into the storage process. But this electricity will have to be produced anyhow. If we want to have the same amount of electricity at the end of the day, we must produce exactly 40% (i.e. 1 ÷ 0.7) extra electricity, which means installing 40% extra of wind turbines or solar panels to produce the electricity that will be lost during storage, with the corresponding investments. This extra investment does not depend on the duration of the storage.
This means that with wind, 50% of production (because we have assumed that half should be stored at some point) must come from an oversized – by 40% – capacity, and with solar 80% of production must come from an oversized – by 40% also – capacity.
Note that other means of storage sometimes put forward have even higher losses. With power to gas to power, the overall loss exceeds 70% of the initial electricity, and it is therefore necessary to oversize by a factor 4 the initial capacity that will supply the electricity stored then returned.
With batteries, if we combine the losses due to the storage itself (10% to 20%) with the “losses” due to manufacturing the batteries (20% to 30% also), the global picture is no better than with pumping stations. But, as we will see below, the investment required is nothing comparable!
Let’s take a breathe!
At this point, we can draw the following – preliminary – conclusions:
- without taking storage into account, waiving nuclear (≈75% of load factor) in favor of wind (≈20-25%) means that the installed power must be multiplied by 3 to 4 to produce the same amount of electricity over the same period,
- with PV (≈10-15% of load factor in mid-latitude countries) it’s 6 to 7 times more capacity which is required for an identical production,
- with wind, ~50% of the consumption must be stored at some time, and with wind it’s ~80%. For the part that will be stored, accounting for losses means that the production (before storage) must be increased by 40%. With wind, it means that the installed capacity must be increased by 50% (fraction to be stored) x 40% (compensation of losses) ≈ 20%, that is an extra 50 GW, leading to a total of 300 GW (the above calculation before storage already lead to 240 GW)
- with PV, the capacity increase is 80% x 40% ≈ 30%, that is an extra 100 GW, leading to a total of 450 GW.
- all storage is done with pumping stations
- the grid must be able to cope with the above mentioned 300 to 450 GW – vs 110 presently, and that leads to double the investment in the production devices themselves.
Sometimes you play each century, sometimes every other decade…
So far, we have compared the installed capacities that would be required depending on the means we use to produce electricity. But these means do not have the same lifetime. Indeed, if a means A last twice the time than a means B, then using A over a given period supposes to invest twice as often as if we use B during the same period of time.
A wind turbine is presently supposed to last 20 to 30 years (Acknowledging that we have little hindsight…), when nuclear can operate for 40 to 80 years (in the US, all reactors running now – about a hundred – have obtained the permission to operate for 60 years, and 80 years will be asked by a number of operators). When going from nuclear to wind, it will therefore be necessary to replace the facilities two to three times more often.
On the other hand, the construction costs of the various means are not the same:
- in the hypothesis of a (re)construction of a long series of reactors (so without having huge overspendings on each construction site!), nuclear power requires about 5000 euros per kW of installed capacity, with a lifetime of 60 years on average (the Taishan EPR in China will be built for about $ 5 billion per unit, that is a little above 3000 euros per kW…)
- we add 500 euros per kW for dismantling costs (the costs for completely dismantled reactors around the world are of this order of magnitude, and, more broadly, dismantling costs for large industrial units containing toxic products – refineries, chemical plants, etc. – amount to about 10% of the construction cost),
- onshore wind costs 1500 euros per kW of installed power, with a lifetime of 20 to 30 years (we will take 25 on average at the beginning).
- photovoltaics also costs 1500 euros per kW of installed power (which corresponds, in order of magnitude, to the lower end of the bracket for the data published by the AIE or NREL, see below), with a lifetime of 25 years,
- for wind and PV, as mentioned above, 1 euro invested in the production system requires about 1 euro invested in the “electrical environment” (grid, transformer stations, etc). Note that this investment is mostly done by local authorities and network operators, and remain therefore invisible in the “cost of production” (which is also true for the cost of storage). We therefore add 1500 euros per installed kW of wind or solar for network costs, with a lifetime of 50 years for these investments (NB: remember that these grid costs are rapidly increasing with the percentage of intermittent sources),
- for offshore wind, the grid cost has been increased slightly compared to onshore wind, to account for the connection between the wind turbine and the coast (which costs alone several hundred euros per kW installed)
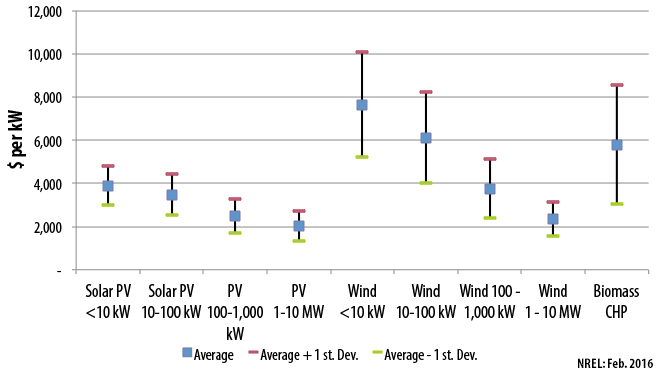
Investment costs, in dollars per watt of nominal power, depending on the global output of the unit. Source National Renewable Energy Laboratory, 2016. One can see that 1,5 $/watt is at the lower end of the bracket, and it is also the case for wind.
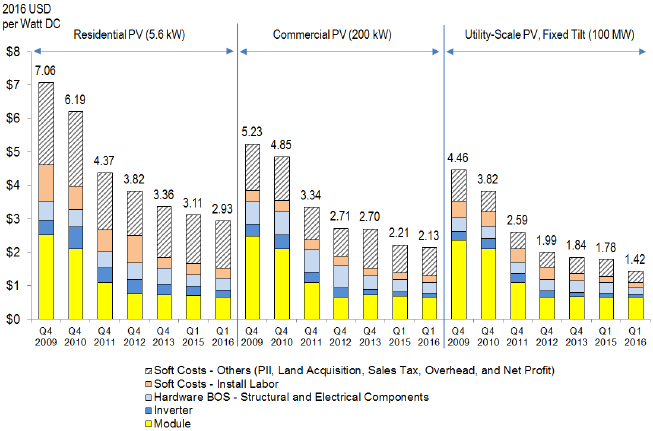
Investment costs, in $ per watt of nominal power. Source National Renewable Energy Laboratory, 2016. The global cost does not diminish so rapidly now, and the remaining decrease comes from other parts than the module.
And now what?
With the “mean” hypotheses above, we can now compare, in order of magnitude, the total investment over a century required to supply the same electricity – for the same load pattern – with a “100% nuke” system (considered as an acceptable proxy for the existing French system, since the absence of dams could be largely compensated by nuclear power with load tracking, equivalent to gas fired power plants) and a “100% wind” system (with two variants: 100% onshore, or 100% offshore), or a “100% PV” system.
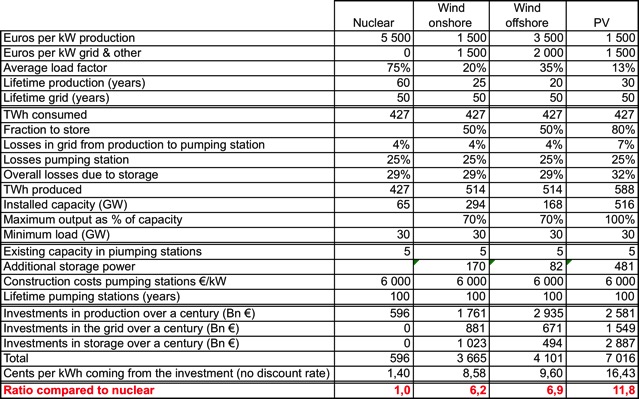
Results of the calculations with the hypotheses previously detailed
This first order calculation shows that a system “100% wind + storage” or “100% PV + storage” requires a total investments which is an order of magnitude above what is required for a mostly nuclear system. The latter requires 600 billion euros over a century to provide France with its current electricity consumption, but with a “100% wind + storage” system, my country should invest about 4000 billion euros over a century (or two years of French GDP currently) to get the same service, and it climbs up to 7000 billion euros over a century (i.e. 3.5 years of French GDP currently) with a 100% PV + storage system.
The Germans, who have “only” 25% of intermittent and fatal sources in their electricity production at the end of 2017, have already invested several hundred billion euros in their “transition” (250 according to my estimates, 500 say others), a figure which is consistent with the calculation above.
This first simple calculation contradicts an idea often put forward, which is that “decentralizing” electricity production leads to a reduction of the overall production cost. Clearly, “decentralizing” production strongly increases the total amount of investments required, and thus the overall cost of supply. It also contradicts the fact, of course, that as production prices seem to be strongly decreasing for wind and solar, we can turn to these sources at no cost. The cost of providing a secured supply is simply elsewhere!
Both for nuclear and wind and PV, the production cost is mainly composed of two factors:
- capital expenditures (operating costs are low for both nuclear and renewables)
- the “cost of capital”, e.g. the amounts that must be paid to the shareholders and/or bankers as a counterpart of having their money.
With a 1 to 6 or 1 to 10 ratio for the investment required per MWh, choosing “renewable + storage” rather than “nuclear and little storage” will lead to a production cost almost 6 to 10 times higher (actually a little less because the cost of capital is currently lower for renewable energies, nuclear energy benefiting – so to speak – from a “spooky effect” which raises the cost of money applied to it).
Currently, electricity costs 3% of their income to households. But only a third corresponds to production. If we multiply the corresponding share by 10, because we go from the present system to a 100% wind or solar one, the electricity bill would jump to almost 15% of household expenditures. But such an increase of the production cost for electricity would also lead to inflation of production costs in the industry and services (that also require electricity), that would probably represent an extra 5% to 10% of the household budget. Shifting from nuclear to 100% renewables is thus something that, on the first order, would require 20% of what people earn for the same service.
It can also be seen that, in the case of a system based on intermittent renewables, the cost of storage alone exceeds the cost of rebuilding the nuclear fleet from scratch. However, neither storage nor reinforcing the grid are taken care of by the producer. This explains this apparent paradox, which is that the cost of “raw” production of a wind turbine or solar panel is constantly decreasing, and yet the cost of electricity for the end consumer, in the countries that develop these modes, never stops growing.
It is simply linked to the fact that the end consumer has to pay for the whole system, not just for production (whereas the producer only sees the cost of production, by definition). The rest of the cost is “passed through” to the end consumer through transportation costs, and taxes (if massive storage in pumping stations is developed, the cost would probably be recovered by grid operators).
We see clearly, with the small calculation above, that comparing the sole cost of production between a controllable mode (the power varies when one decides it) and a fatal system (the power varies when the external events decide so) is not appropriate. In fact there are only two ways to compare the two:
- either we keep the controllable mode in addition to the fatal mode, to ensure supply at any time (including when there is no wind or sun). At this moment the fatal mode only allows to save fuel in the controllable mode when there is wind or sun. With nuclear power, this fuel cost is below 5 euros per MWh. In France, it is therefore necessary that the cost of full production of wind or PV falls below 5 euros per MWh in order to declare that wind or solar are “competitive” compared to nuclear (moreover, shifting from nuclear to renewables will not save a gram of CO2, since nuclear energy does not emit more than wind power, and actually less than photovoltaics). In such a case, the development of fatal modes does not reduce the installed power of controllable modes, but just lowers the load factor of these modes (there are used less often).
- either we suppress the controllable modes, and then we must develop storage and strengthen the network, and include the corresponding costs in the calculation, which brings us back to what is developped above.
Could we store for a cheaper price on batteries, then, as the costs keep falling? In the calculation above, we came to the conclusion that the storage power was over 100 GW, which means roughly 1 TWh of storage capacity if we use batteries (for standard batteries a typical charging time is 10 hours). This actually represents a little less than one day of electricity consumption in France, and we can assume that our batteries should be able to cope with at least one day with no wind and almost no sun (a gloomy winter day with little wind for example).
Even with a storage cost that would come down to 100 euros per kWh (today it is 300), 1 TWh of capacity costs more than 1000 billion euros. If we assume a lifetime of 10 years, it means a bill of 10.000 to 12.000 billion euros per century to ensure this storage. As a comparison basis, the real estate owned by the French households – something that also lasts for a century, or more – is worth 7000 billion euros “only”!
In other words, if we include the security of supply, the “Rifkinian” dream of everyone having his autonomous solar panel and battery, while benefiting from the same standard of living than today, means investments that are out of reach. Such a view corresponds to a world without limits, and is the “solution of the super rich”, and not at all the solution of the poor, suited to a physically – thus economically – constrained world! A centralized system is always much cheaper because it allows for a higher load factor, and less storage investments. This is the reason why it first developed all over the world.
Let’s be optimistic!
To test – a first time – the sensitivity of the result to the hypotheses, we will now assume that we are in the most favorable context possible for renewable energies (and symmetrically nuclear has a very poor performance):
- only half the production for PV has to be stored,
- investments in the grid represent only 2/3 of the investments in production for renewables,
- the lifespan of wind turbines has risen to 30 years (25 years for offshore to take into account harsher conditions in the marine environment),
- the lifespan of nuclear reactors is lowered to 40 years, and its cost increased to 6500 euros per installed kW, including dismantling,
- the losses of pumping stations are lowered to 20%, and the cost per installed kW lowered to 5000 euros.
With these assumptions, the results are as follows.
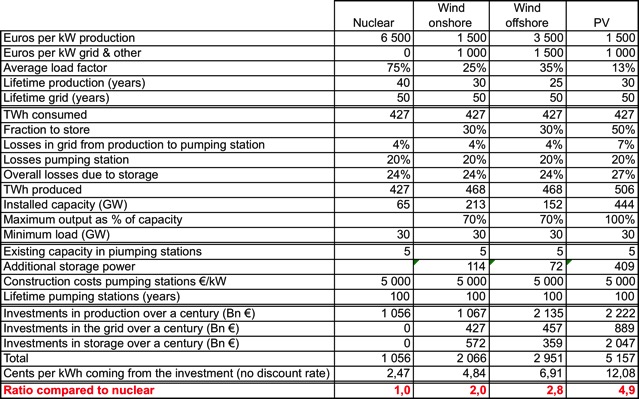
It happens that even the cheapest renewable energy + storage option asks for twice the capital than a “poorly performing nuclear” does. And a “solar + storage” system is still 5 times more capital intensive than nuclear, if the storage is done with pumping stations (with batteries the ratio jumps to 10:1).
In fact, it can be seen from the table above that even if the solar panel or the wind turbine were free, the sole investments required to reinforce the grid and store the electricity (in the case of 100% wind or 100% solar) would cost more than the total investment in the nuclear fleet.
Let’s be optimistic! (but not the same way)
We can also assume that the situation is more favorable to nuclear than what we have used in the “mean” situation, and conversely renewables perform poorly:
- nuclear costs only 4000 euros per kW of nominal capacity, all included: 3000 for construction (which is roughly what happened in Taishan, with no series effect still), 500 for a significant upgrade, and 500 for dismantling,
- the lifetime of nuclear is raised to 80 years (cf USA),
- onshore wind has a load factor maintained at 20% (the best sites are equipped first)
- the overall storage losses are set at 35% (to account for less favorable places, the fact that reverting pumped water to electricity also induces losses, etc)
The application of this set of hypotheses gives the following result:
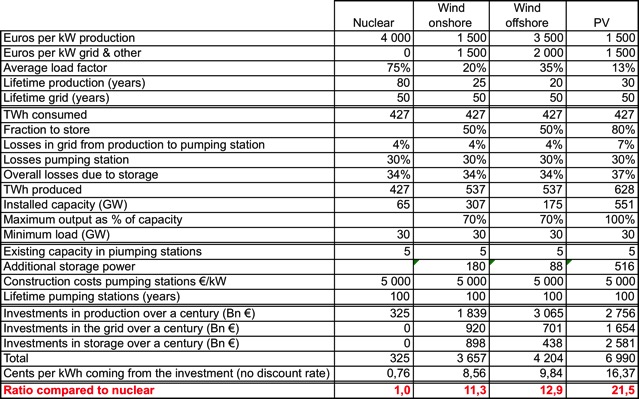
This comparison between an “optimized nuclear” vs renewables “progressively deoptimized” is, unsurprisingly, even more favorable to the atom. Is it necessarily unrealistic in a long term view?
- only 30% of the construction cost for nuclear energy corresponds to what is totally unavoidable to produce electricity (with no harm to the environment in regular operations): core, steam generator, pipes, alternators, etc. 70% is a “cost of precaution” (that some might call the “cost of fear”!), devoted to prevent a dysfunction (even very unlikely) to cause harmful – or even noticeable – consequences: redundancy of systems, extra thickness of concrete walls to cope with very rare and extreme events (for example to be able to stand a very improbable aircraft accident), delays lengthened to check everything 3 times, etc. The historical cost of construction of the current French fleet was around 1500 euros per nominal kW. Jumping to 4000 – in the “optimal nuclear” version above – is already a huge increase, and it is mainly due to an “increase in precaution”, leading to adding plenty of safeguards without really wondering whether they are cost effective. It is not here my intention to discuss whether it was relevant to do so, but just to point out that 4000 euros per kW remains a very “comfortable” level to accommodate for all the necessary safety. Sticking to a strict cost-benefit arbitration would most probably lead to stop at this level, or below,
- Wind turbines and solar panels require many more metals and materials – steel, copper, concrete, rare metals… – than nuclear per kWh produced depending on what we look at (10 to 50 times more). For now, these materials are available at low prices … thanks to fossil fuels! These fossil fuels make it possible to run mining equipment, blast furnaces and foundries, international transport, steel mills and chemical plants, and a whole bunch of other things that are essential for the manufacturing of solar panels and wind turbines. If we have only solar panels and wind turbines to operate mine dumpers, nickel ovens, container ships, and cement plants, are we sure we will keep the same “low cost” for solar panels and wind turbines? (of course not, my bet is a multiplication by anything between 10 and 100 in such a case)
- with a massive deployment of solar or wind, the performance of the last panel installed, or the last wind turbine installed, might be poorer than the average of the previously installed base: the good locations would probably be taken first, in terms of yield, proximity to the grid, etc.
It is important to remember, when performing this kind of rough calculation, that the future may be more favorable than expected, but it may also be more adverse!
Let’s be fair!
Eventually we can end this sensitivity test by taking “favorable to all” values for all modes.
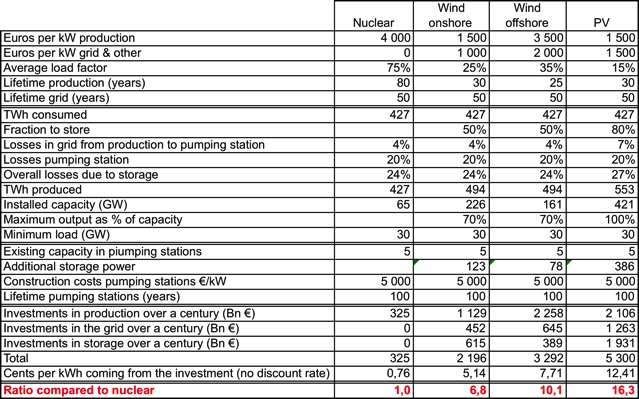
The strong conclusion of these sensitivity tests is that, if we take into account a broader array of system costs (and still, some are not taken into account, see below), nuclear is much more competitive than “modern” renewables to produce low carbon electricity. The only renewable that can compete, because precisely it is already centralized – by nature – and controllable, is hydroelectricity.
“But, what about catastrophies?”, the opponent to nuclear energy will ask? “What about Chernobyl and Fukushima?” If we say that such a catastrophe would total a few hundred billion euros (which would reflect a cost of panic far more than a cost of real damages), and that we have the unpleasant surprise of having one per century, it still does not change the overall economic result.
Conversely, we did not take into account the costs of expropriating land owners, and of ecological losses, if we build 200 GW of pumping station, that is 100 to 500 very large dams. 1 million people we displaced to build the Three Gorges Dam : it’s not nothing! And the biggest catastrophe of all times regarding dams killed several ten thousand people (Banqiao in China in 1975). Nor did we consider the costs associated to expropriating land owners for power lines, etc.
It goes better
All the above has not taken into account the fact that solar and wind are complementary to each other: the sun is brighter in summer, when the wind is weaker; and also more present during an anticyclonic period, when there is no wind. Conversely, in winter, when there is little sun, there is more wind. Having a combination of wind and solar would certainly lead to an optimization of the system that will lower the investment costs taken into account. How much is not any more a “first order of magnitude calculation”, but we can still give indications:
- the first difference between nuclear and wind or solar comes from the big difference on the load factor. Solar has an average load factor of 13% in France, and wind 20%. This is still way below what nuclear power can provide (75% with load tracking; 90% when only baseload)
- the second comes from the increase in installed capacity, which drives the additional network costs. This increase remains very significant in the case of a wind + solar combination, as the installed capacity is increased by a factor 3 at least,
- the third comes from the difference in lifetime (≈ 30 years for wind and solar, ≈ 60 years for nuclear)
- the storage power, which amounts to a couple % of the installed capacity for nuclear, jumps to several ten % of the installed capacity with a combination of solar and wind, which means a massive difference anyway compared to a controllable mode.
A mix of wind and solar will definitely allow for optimization, but it is unlikely that it could be enough to compensate for the huge increase (by a factor 10) of the investments that is necessary when going from a massively nuclear” to a “massively RE” system (and remember that the exercise here is to compare two “decarbonized” systems!).
It’s not so good (a first time)
At this point, some advocates of a fully wind and/or solar system might say that a huge increase in investments is not an issue. Since the economy is growing, there is more and more money available each year, and besides a Keynesian model will show that the more we invest, the strongest growth rate we will get. So?
Well, it happens that whatever the theory says, what we can witness for France is that the growth rate has kept falling for the last decades.
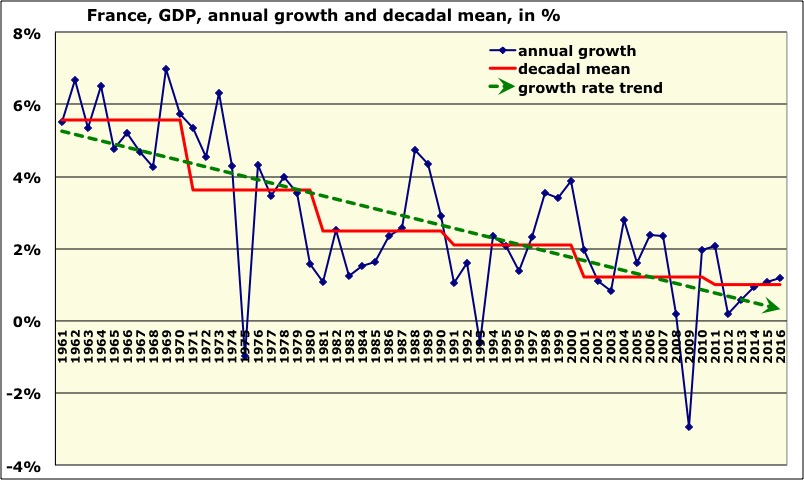
GDP growth rate in France since 1960 (primary data from World Bank). For each decade, growth is lower, on average, than what it was during the previous decade. This trend is a direct consequence of the trend on the energy supply (below), and the causality link between energy and GDP.
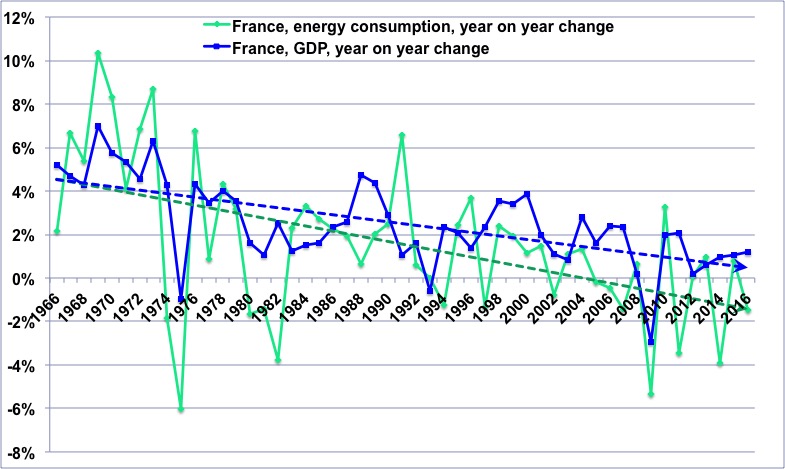
Year on year change of the GDP in France since 1965 (in blue, primary data World Bank) and Year on year change of the quantity of energy used in our country (primary data BP Statistical Review, processing by your humble servant). The gap between the two trends is the famous “energy efficiency gain of the economy”, which decouples a little, but not in a fundamental way, the dependence of the economy on energy.
For “physical” reasons, the trends that one can see in the above graphs are likely to continue in the coming decades, and they are also valid for Europe as a whole. The consequence is a dire one: most of the “transition” will have to be performed in a recessive context, and not in a growth context. Knowing that we are in a race against time to mitigate climate change, is it serious to pretend solving a problem (removing fossil fuels from electricity production) by calling on the most expensive solution instead of going to the cheaper one?
And, in France, would it be serious to spend several thousand billion euros, in an economy that will soon go into structural recession, to avoid a risk (the nuclear risk) which is actually very minor compared to that of cigarettes, alcohol, cars, fatty and sweet foods, and stairs (domestic accidents cause thousands of deaths a year)? And it is interesting to note that the same United Nations that alert us strongly on climate change is also able to inform us on the fact that nuclear energy is not the ultimate devil that many (in my country) think it is…
It’s not so good (a second time)
So far, we have made an assumption which is that the electricity provided by wind turbines or solar panels is of regular “quality”, just as if it were provided by “conventional” means (coal, gas, nuclear, hydro).
Unfortunately, it is not exactly the case. And the reason is that our electricity is supplied in alternating current, with a frequency set very precisely on 50 Hz, not more, and not less (or more exactly the tolerance is 0,05 Hz). This very fine setting is now essential to ensure the correct functioning of many devices that can be found everywhere, and in the management of the grid to start with.
If the frequency decreases a little too much (of 1 Hz), it means that the load is excessive compared to the production, and then there is an automatic triggering of load shedding somewhere, which means the end of supply for everyone. In the worst cases, cascading sheddings can lead to a generalized blackout.
With the present controllable modes, this adjustment to a precise frequency is easy to perform, because most of the generation is done with “rotating machines” that we find everywhere. In “thermal” plants, which account for 80% of the world electricity production, the heat produced by the combustion of the fuel – coal, gas, oil or nuclear fission – is used to produce steam that will power an alternator, which is a “rotating machine”.
With hydropower (15% of the world electricity production), the water sets in rotative motion a turbine coupled to an alternator. In all cases (thermal or hydroelectric), the system is designed so that the frequency of rotation of the alternator is exactly 50 Hz. If the frequency drops a little on the network, an order is automatically transmitted (without need for human intervention) by the grid control devices to a power plant (or more) to open a little more the steam inlet valves (as there is always a small margin) that power the alternator, or the flow of the water that does the same through the turbine.
At this moment, the torque that puts the alternator in motion increases, so does the rotational speed, and the frequency of the network rises again to the nominal value, in the space of a few tens of seconds. Conversely, if the frequency has become too high, the grid control devices sends – just as automatically – the order to reduce the steam or water intake a little where needed, the torque decreases, and the frequency returns to the good value. These servo mechanisms are very easy to implement because there are these famous “rotating machines”.
But with photovoltaics, there is nothing that turns, that could increase or decrease the rotating speed depending on the frequency on the grid. Actually a solar panel is a static device producing direct current, and then an inverter turns it into alternating current with the help of power electronics.
A windmill is certainly a rotating machine, but… not always at the right speed. As a result, even a wind turbine passes through “direct current” step, which will then be transformed into AC by an inverter, with power electronics again.
And power electronics are much less efficient than a true rotating machine “catch up” a small frequency shift. This is what makes some experts say that, even if we had the physical and economic opportunity to multiply investments by 10 as mentioned above, we would have the physical impossibility to ensure the stability of the frequency on the grid with only wind and solar, or even more than a few tens percent.
Germany, which gets “only” 25% of its electricity from wind and solar combined, already needs the help of its neighbors for its frequency setting. Nothing is simple …
Eventually…
A carbon-free electricity fully produced with wind and/or photovoltaics requires roughly 10 times more capital than if it is produced from nuclear power. In France, to maintain a carbon-free power supply once the current reactors are decommissioned (which will eventually happen, whether after 40 years, 60, 80 or 67.4…), the best idea is therefore … to build new nuclear reactors.
But we can draw from this “factor 10” another interesting conclusion: let’s assume that we can invest a given sum each year in the global electricity system to replace coal by “carbon free electricity” (if it is a constant fraction of the GDP, it is close to a constant sum of money). If we only allow a combination of wind, solar and storage, it will take 10 times more time than if it can be done with nuclear.
And we are in a race against the clock: to limit to 2 ° C the rise of the global temperature between 1850 and 2100, it is necessary that the planetary emissions become null between 2050 and 2080. All electricity production must therefore become completely carbon-free as soon as possible, and ideally not later than 2050 (because it is one of the sectors where it is the easiest).
With nuclear, replacing all coal fired power plants in the world (a little over 2000 GW presently) would cost 10,000 billion dollars. With wind and solar, it jumps to at least 100,000 billion dollars, knowing that the overall investments in the energy sector are now close to 1500 billion dollars each year. With nuclear we can make it in the delay, with just wind and solar we can’t.
In other words, focusing primarily on intermittent and fatal renewable electricity to make our electricity carbon free paradoxically increases the probability of losing the race on climate change. We would trade the waiving of minor risks (those associated to nuclear electricity) in exchange of the increase of a massive risk (the consequences of climate change). It is a funny conception of a “good” idea!
50%, then?
In France, there is today a kind of “consensus” on the fact that OK, we do not waive nuclear completely, but still, it would be a good idea to have a smaller fraction of atomic power in our electricity generation. On the way for 50%!
A lower risk?
One thing should be obvious, the reader might think: if we go from 75% to 50% nuclear in the production, then we will reduce the number of reactors by one third, and the risks will decrease in proportion. But unfortunately there is no such thing as a proportionality rule between a decline in production and a decline in installed capacity.
As long as our country is organized the way it is, with factories that operate when the clients demand it and not when there is sun or wind (and in particular mostly during the day, more during the week than on weekends), with the 8 o’clock train leaving at 8 o’clock and not when there is wind or sun, with the lift coming when you ask for it and not when there is wind or sun, with the hot tap water available when your take a shower and not when there is wind or sun, with people watching the 8 o’clock news at 8 o’clock (weird, isn’t it?), with hospitals taking care of patients when they are ill and not when there is wind or sun, with shops open when customers want to come, etc., the load curve for electricity will not change much.
We can certainly shift some uses a couple hours (for example an electric heater can shift for an hour, a washing machine too, and a fridge can stay without electricity for a couple hours), but we can not shift every domestic use for 24 hours, nor put in summer the uses that arise in the winter.
In other words, as long as our social organization remains similar to what we currently know, we will keep the same peak load of about 100 GW at 7 pm in cold winter days. This value can decline over time if our overall consumption drops, but otherwise it won’t.
As there is no guarantee that the maximum load happens when there is wind and sun (actually it’s pretty much the opposite: at 7 pm in the winter solar power is nil, and the load factor of the wind turbines can drop to 1%), we must keep the same controllable capacities we have today to ensure the security of supply. Otherwise there would be some load shedding, that today the Western world is not ready to consider as “normal”. This means that the increase in intermittent and fatal means will not lead to the elimination of existing controllable modes, but simply to using them less, or not at all, when there is wind or sun.
In other words, reaching 50% of nuclear in the annual production (instead of 75% today) will not be done through a decrease of one third of the nuclear fleet, but through a decrease of one third of the load factor of the existing reactors.
The example of Germany is quite enlightening in this respect: this country has installed nearly 100 GW of wind and solar power in 15 years (98 to be precise, below).
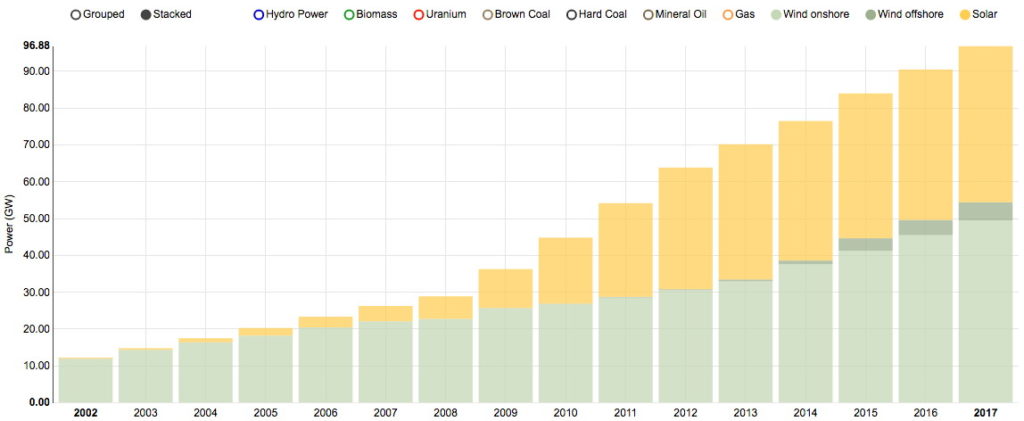
Installed capacity in solar panels and wind turbines in Germany at the end of each year, in GW (one GW = one million of kW). What a rise! Source Fraunhofer Institute.
If “more electricity coming from a higher installed capacity in wind and solar” lead to a decrease in the previously existing capacities, we should note such a decrease in the capacity of controllable modes in Germany. Surprise: there isn’t any!
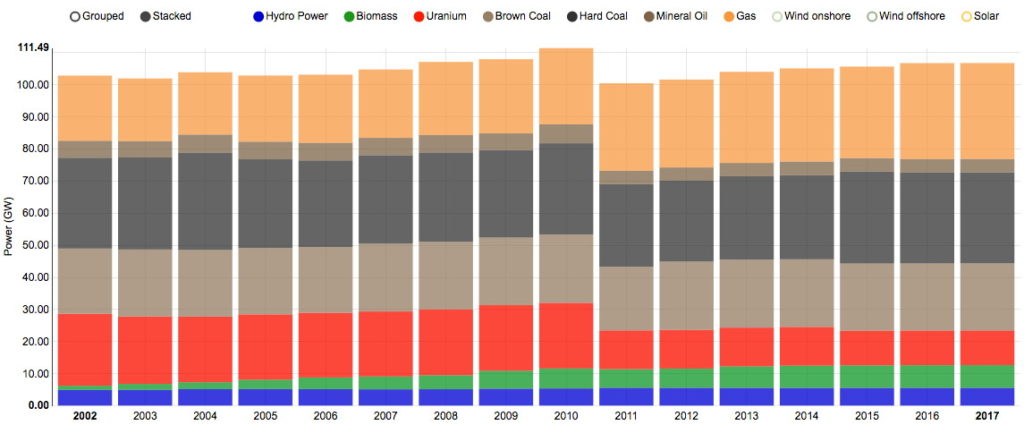
Installed capacities in controllable modes in Germany. Surprise! The present total is over what it was before the “Energiewende” began, while the consumption didn’t change, see below. Source Fraunhofer Institute.
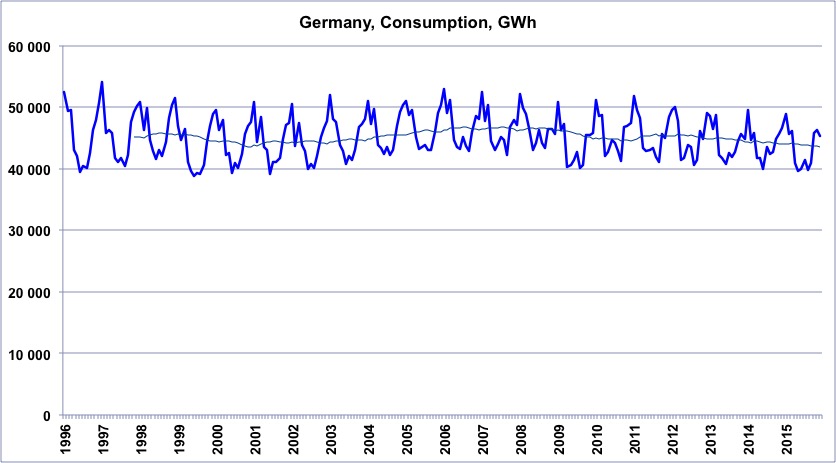
Monthly electricity consumption in Germany, in GWh (one GWh = one million kWh), from 1996 to 2015. In 2002 the consumption was rather a little above what it was in 2015… Source ENTSOE Data Portal.
The example given by our Northern neighbors is not particularly convincing when trying to prove that adding wind turbines and solar panels will lead to a significant reduction in the pre-existing controllable capacities. The Germans definitely have a little less nuclear today, but more gas, and a total controllable capacity that remained unchanged. However, the total installed capacity doubled, going from 100 to 200 GW!!
In Spain or Italy, the same thing happened: the rise of solar and wind has not lead to a decrease of the controllable means. What replaces them, or rather lowers them, is the economic contraction!
If, in France, nuclear energy goes down to 50% of the total electricity generation, the load factor of the reactors drops by a third. But these reactors are fixed-cost systems: they cost the same for their construction and operation (maintenance, personnel, etc.) irrespectively of the fact that they produce 1 billion kWh or 1 kWh in the year.
If the load factor of these reactors is lowered by one third, one of the two following things can happen:
- either the operator of the fleet (EDF) sells (for competition reasons for example) the kWh at the same price than before, in which case the revenues of the operator decrease by a third, while the costs remain about the same. With less money to maintain each reactor, it is not difficult to predict that it will not really lower the nuclear risk! It is even quite easy to predict that the end of the story is either successive recapitalizations, or a bankruptcy filing….
- or the price of the nuclear kWh is increased by 50% to cover the costs. In this case the risk is unchanged, and we have just added the cost of wind turbines and solar panels to the cost of the nuclear fleet (and this explains why the overall cost of the electric kWh for the end consumer in European countries is globally a linear function, with a fixed term that corresponds to the system cost before the rise of renewables, and a “new” term which is proportional to the installed capacity in solar and wind).
Less CO2?
Since splitting an atom of uranium in 2 is not equivalent to oxidizing an atom of carbon, a nuclear reaction does not emit CO2 in itself. The carbon footprint of nuclear corresponds to the emissions that arise from mining operations, the enrichment of uranium, the construction of the power plant, commuting of employees, logistics, heating of the offices if it is done with gas or fuel, etc.
But nuclear energy is so dense (fissioning a gram of uranium 235 releases as much energy as burning a ton of oil) that, when brought back to the electricity produced, nuclear emits little CO2: about 10 grams of CO2 per electric kWh (coal is at 1000). Let’s recall that the “white smoke” that can be seen above the cooling towers is only water vapor, and that human emissions of water vapor do not contribute to climate change.
10 grams of CO2 per electric kWh, that’s also what we get for wind turbines, except that for the latter we also have to account for storage devices, reinforcing the grid, losses due to storage, etc.
On the other hand, photovoltaic is rather between 50 and 100 grams of CO2 per electric kWh, because manufacturing electronics grade silicon is very electricity intensive, and for the time being the said electricity is not provided by other solar panels, but by … Chinese coal power plants!
Replacing nuclear energy by solar photovoltaic thus increases CO2 emissions, and does not lower them. Of course, at the very beginning, the first solar or wind capacities also phase out a little coal (there is some in France) and gas. The “average carbon content” of what is replaced is then a little above the “carbon content” of the solar.
But the more the percentage of solar and wind increases, the less coal and gas remains to be removed. Pretty quickly, then, the additional solar and wind will replace mostly to only nuclear power, without any gain on CO2 emissions.
More jobs?
Replacing nuclear by wind or solar is also supposed to help jobs, something particularly precious (and for pretty good reasons). Unfortunately, we will get the exact opposite of what we would need: the development of wind and solar globally destroys jobs in our country!
The reason is quite simple: to produce a MWh (MWh = 1000 kWh) with a nuclear reactor, France must import about 1 euro of uranium. With solar or wind power, producing a MWh require to import 20 to 30 euros of components (the module for solar, the turbine for wind). In other words, when amortizing the cost of these parts (about one third of the full construction cost of a solar or wind unit) over the global amount of MWh that will be produced over the lifetime of the device, we get about 20 to 30 euros per MWh. So, switching from nuclear to wind or solar increases the imports (by 20 euros per MWh produced), and – because of the very definition of the GDP – decreases the GDP. If the average revenue per person at work remains the same, the employment also decreases.
We had the same kind of nice story coming from the proponents of super and hyper markets a couple decades ago. The PR of these stores have always pointed out that in their stores they created jobs: in the hypermarkets, it was certain. In shops at large, it was the exact opposite!
At the very end
Going to a low carbon economy is urgent. If we are serious about it, the good idea is not to waive nuclear for renewables, but to replace everywhere on the planet coal and gas fired power plants by what has the lowest overall system cost: nuclear. Not doing it is, explicitly, suggesting that we take 10 times more time to phase out coal and gas from electricity generation (that represent together 28% of the overall greenhouse gases emissions in the world), which is equivalent to considering that climate change is a minor risk compared to the nuclear one. It is not because it is trendy that it is true.