Our species is not, of course, the only source of CO2 poured into the air : for billion years the atmosphere has been exchanging carbon, perfectly “naturally”, with various other stocks that exist on Earth.
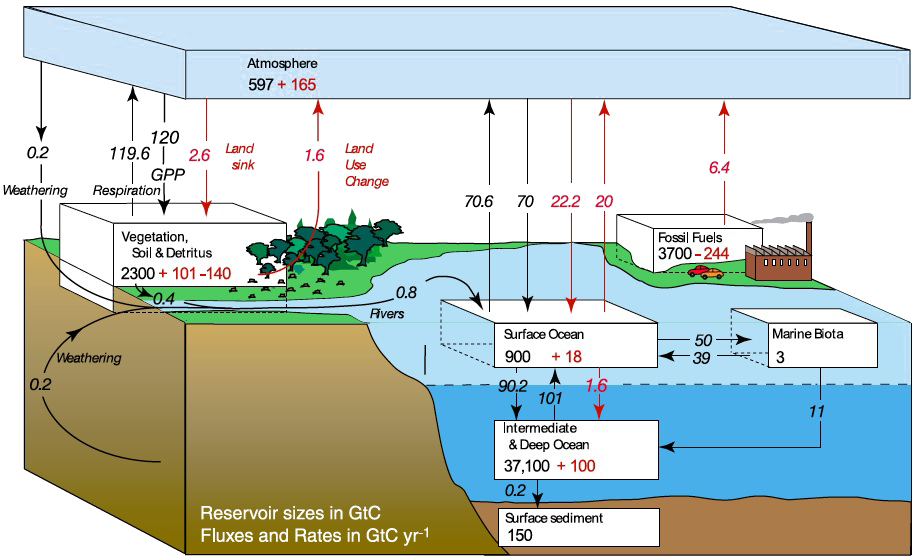
This diagram shows the main carbon pools on Earth, limited to those that can exchange significant amounts of carbon at the centenial to millenial scale (lime is thus not shown, though it constitutes the largest stock of carbon on Earth).
Figures are in gigatonnes (billion of tonnes) of carbon (GtC).
Flows in black represent the “natural” exchanges, that is those that existed in 1750, before the beginning of our industrial activities (1750), and pool figures in black represent the amount of carbon stored in 1750.
Flows in red represent the human direct or indirect average contribution for the 1990’s, and stock figures in red represent the net effect of human activities from 1750 to 1994.
This diagram means, among other things (additional explanations in the rest of the page) :
- that the ocean sediments that constitute the top of the ocean floor contain 150 billion metric tonnes of carbon, an amount that has not changed since the beginning of the industrial era,
- that the intermediate and deep ocean contained 37.100 billion metric tonnes of carbon in 1750, an amount that went up 100 billion metric tonnes since the beginning of the industrial era,
- that terrestrial ecosystems contained 2.300 billion metric tonnes of carbon in 1750 (in the vegetation, soil and humus), an amount that went up 101 billion metric tonnes since the beginning of the industrial era because photosynthesis continuously increased since then (see below why), but in the same time went down 140 billion metric tonnes because of forest clearing (see below why forest clearing leads to carbon emissions),
- that the atmosphere contained 597 billion metric tonnes of carbon in 1750, an amount that went up 165 billion metric tonnes since the beginning of the industrial era because of our CO2 emissions,
- that the overall extractible fossil fuel reserves (oil, gas and coal ; oil geologists use the term “ultimate reserves“) totalled 3700 billion metric tonnes of carbon in 1750 – before we began to dig in it – and that at the end of 1994 we had extracted (and burnt, with CO2 going into the air) about 244 billion metric tonnes (note that between 1994 and 2005 this figure has rose by 30%).
It is important to note that the “natural” – or “pre-industrial” – exchanges between the atmosphere and the rest of the planet are balanced : in such a “natural” state, each year 70,6 GtC “go up” from the oceans (see below why) and 119,6 GtC “go up” from the terrestrial ecosystems (respiration of living beings), for a total of 190,2 Gt , while 70 GtC “go down” to the oceans, 120 to the terrestrial ecosystems, and 0,2 through weathering (atmospheric CO2 dissolves in rain water), the total being also 190,2. Balanced pre-industrial exchanges are the logical counterpart of a CO2 concentration that remained constant over several thousand years before 1750.
NB1 : CO2 emissions coming from fossil fuels, that amounted to 6,5 GtC – about 24 billion tonnes of CO2 – per year during the 1990’s (figure on this diagram) are today close to 8 GtC per year – almost 29 billion de tonnes of CO2.
NB2 : GPP means Gross Primary Productivity (that is the Gross result of photosynthesis).
Source : IPCC, 4th Assessment report, 2007
As the above diagram shows, there are numerous pools and flows of carbon on our planet. In most of the these flows and pools carbon is associated to other atoms : in fossil fuels it is associated to hydrogen (the result being hydrocarbons), in the oceans it is associated to oxygen and sometimes hydrogen to form CO3– and HCO3- ions, in the exchanges with the atmopshere it is associated to oxygen (CO2) or hydrogen (for methane emissions), etc.
However, in this kind of diagram only the weight of carbon is mentionned, not the weight of the associated elements, to allow for comparisons and quick checks. All of the above pools and flows is named the “carbon cycle”, in which most of the flows are of course “natural” (but it does mean that human influence can be declared negligible before looking at figures !).
For the “natural” part of the cycle, the figures are as follows :
- 120 GtC are echanged each way between the terrestrial ecosystems and the atmosphere. The downgoing flow is of course due to photosynthesis, and this CO2 used by the vegetation then appears in the carbon stored in the living and dead beings. The upgoing flow has two components :
- a first term (about half of the total) comes from the repiration of plants (that kind of breathe, yes they do !) and “macroscopic” animals,
- a second term comes from the respiration of micro-organisms that decay organic matter (which is why it is sometimes said that decay provides half of the upgoing flow of carbon). This flow is partly seasonal, because it is fed, among other things, by the decay of dead leaves that fell in antumn,
- 70 Gt – each way also – are exchanged between the surface ocean and the atmosphere. No living organisms here to feed the flows : there are only physical causes. It happens that cold water dissolves CO2 better than warm water. As a result, when water that is saturated in CO2 (meaning that it could not dissolve more CO2) at a given temperature is warmed, it will not be able to “keep” all this dissolved CO2 and will emit part of it into the air. On the opposite, when it cools down, the “CO2 storage ability” of the same water increases, and will be able to substract some additional CO2 from the atmosphere. This physical property of a storage capability that decreases with temperature explains most of the atmosphere-ocean exchanges :
- where oceanic water is cooling down, the CO2 flow goes from the atmosphere to the ocean ; oceanic currents going from the tropics to the poles are therefore “CO2 sinks” (water that was initially warm cools down and removes CO2 from the atmosphere),
- where oceanic water is warming up, it’s the exact opposite : the CO2 that becomes “in excess” in saturated water is emitted to the atmosphere (a warming saturated water is therefore a CO2 source).
- what closes the loop is the global oceanic overturning : the CO2 emitted by a given warming water has obviously been absorbed when the same water was cooling down, “elsewhere on Earth “, carried by another current.
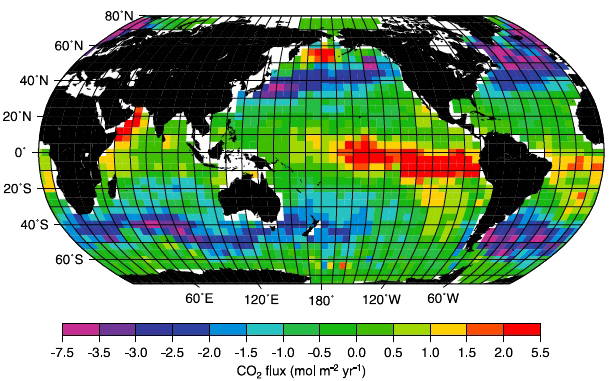
Simulated average monthly CO2 exchanges between the ocean and the atmosphere, computed from 41 years of pH and wind speed measurements. The yellow / red boxes correspond to an “upgoing” flux, and the blue / green to a “downgoing” one.
One can easily see that the ocean is a source in the Eastern Pacific, where cold and deep water is upwelling, then warms up and releases parts of its dissolved CO2. On the opposite, when surface currents lead water to cool down (including the Gulf Stream, on the right of the planisphere), the net flux is going from the atmosphere to the ocean.
Source : IPCC, 4th Assessment report, 2007
- at last, 40 to 50 GtC are exchanged each way between the ocean and marine life (by the way, the carbon stored in marine life is ridiculous compared to the carbon stored in terrestrial life : 3 GtC in the water, 1500 GtC on the soil !). The general principle is the same than on the ground : marine equivalents of plants (that is algae and phytoplankton) capture some CO2 – dissolved in the water, though – through photosynthesis, then are either eaten (dead or alive) by animals that breathe (first source of CO2), or die without being eaten. In the latter case, a large part decays, with CO2 emissions, or they sink to the oceans depths where they sediment and/or feed anaerobic life, then producing methane.
If man has not created the carbon cycle (so much for our pride !), we nevertheless have significantly modified it, and it will make all the difference regarding the future climate. Our first influence is direct, and it is of course to have added emissions :
- fossil fuel use and cement production have lead to average emissions of 6,5 GtC per year for the 90’s, and today we are almost at 8,
- deforestation has added an additional 1,5 GtC per year. The main driver of deforestation is forest clearing in order to gain new arable land or pastures, what gives birth to two flows of CO2 :
- Most of the wood cleared is burnt (and often the clearing itself is done through fire), what directely leads to CO2 emissions,
- Once the land is used for crops, tilling increases the contact of humus with the air (and more precisely with the oxygen in the air), which boosts the activity of aerobic micro-organisms that decay humus, the result being that the carbon content of a cultivated soil is much lower than the carbon content of a forest or pasture soil, the difference becoming airborne,
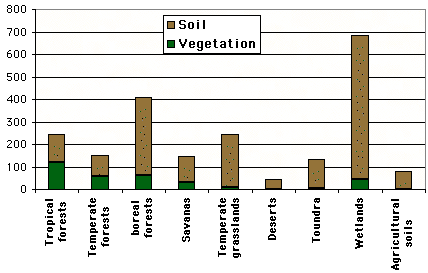
Approximative values of the carbon content (tonnes per hectare) for various vegetation types.
Source : IPCC, 2001
- Emissions coming from deforestation are sometimes labelled “land use change” emissions by specialists, because when a former forest is used to grow crops or feed animals (pasture), the use of the soil has changed. This category also includes the reverse, that is a former cropland on which the forest regrows again, but that is not the dominant case on Earth ! The “deforestation” category also includes, sometimes, a particular source : the emissions coming from forest fires other than land clearing, and from peat fires (but not from coal mine fires).
t is important to know that the contribution of deforestation is evaluated with an error margin of 1 Gt : it is very significant for something that is of the same magnitude !
Having imbalanced the global system, our direct emissions have generated other flows, that we could label indirect effects (in red on the diagram at the top of the page). A first category will apply to the ocean :
- the increase of the atmospheric CO2 has created an additional flux of CO2 to the ocean (presently 22,2 billion tonnes of carbon per year) : as indicated above, physics are such that the proportion of CO2 in the air tends to equilibrate with the “proportion of CO2 in the water” (physicists say that the partial pressures tend to equilibrate), and thus more CO2 in the air generates an increased “downgoing” flux of CO2 to the ocean.
- on the other hand this additional CO2 in the air will generate a global warming of the Earth surface, that will of course apply also to the ocean, and this will have an opposite effect. As we have seen above, warm water is less efficient to dissolve CO2, so that a warming of the surface ocean will globally increase the emissions and lower the capture of CO2 by seawater, with a net effect that is an additional upgoing flow of 22 billion tonnes of carbon per year,
- and at last, because the overturning (vertical current “burrying” surface water in the deep ocean) precisely takes place where the water is coldest (hence very “rich” in CO2), part of the extra CO2 absorbed by the ocean is “injected” to the depths (1,6 billion tonnes of carbon per year at present times). This thermohaline circulation is substracting carbon from the surface for a significant time, either in the form of ions (carbonate and hydrogenocarbonate), either in the form of the remains of marine life. The dissolved carbon carbone will be brought back to the surface after a couple centuries, with the upwelling of deep water, but the ocean floor sediments will keep their carbon for a much longuer time : it requires a couple tens million years before the carbon they contain is injected anew in the carbon cycle through volcanoes, when tectonics (the slow drifting of continents) will bring the sediment in a highy active zone.
For the terrestrial ecosystems, the response induced by more CO2 in the air is also diverse :
- an increase of the atmospheric CO2 globally favors photosynthesis hence plant growth (as a matter of fact, increasing the CO2 in the air is done in some greenhouses to accelerate tomato growth, so it works !), and therefore increases the terrestrial sink,
- but the global warming increases the rate of decay of organic matter, thus enhances the “upgoing” flux of CO2 of terrestrial ecosystems. At present times, the additional sink dominates the additional emissions, with a net effect amounting to 2,6 GtC per year towards the ground (in the diagram of the top of the page), but a major question is to know whether this situation will remain in the future (see below).
At this point, a simplified global picture is that our direct emissions coming from fossils fuels (about 6,4 GtC/year on the diagram at the top of the page, almost 8 today) and deforestation (about 1,6 GtC/year on the diagram at the top of the page, almost 2,5 today) generate in turn an extra uptake of 2,2 GtC/year from the ocean, and of2,6 GtC/year from the terrestrial ecosystelms. Any high school student will easily calculate that 6,4 + 1,6 – 2,2 – 2,6 = 3,2, that is that the CO2 buildup in the atmosphère is each year a little below 50% of our direct emissions (this is the reason why a worldwide division of the CO2 emissions by 2 at least is inevitable – so that our emissions do not exceed the sinks – and will eventually happen, the only question being how and when).
How could all this evolve in the future ?
- As for the ocean, its uptake will continue to increase with the increase of CO2 in the air, but decrease with a temperature rise. An additional consequence of rising temperatures could lead to an ever steeper decrease : the stratification of the ocean, a state where the thermohaline circulation weakens or disappears as a result from a strong surface warming near Greenland. The deep ocean then stops to exchange water with the surface ocean, and the latter, that cannot take advantage anymore of a descending current to “send lower ” the CO2 it took from the atmosphere, will saturate much faster in CO2 (and thus be a weaker sink).
- As for terrestrial ecosystems, the future situation will depend on a large number of outcomes, but an acceptable vision is to conclude that :
- at the beginning, both the photosynthesis and the decay increase, because a climate globally warmer and wetter favours both plants and micro-organisms,
- but the downgoing flux (photosynthesis) relies almost totally on complex beings (plants) that will begin to suffer when climate change is significant, whereas the upgoing flux is half composed of the repiration of micro-organisms that are much more resilient to change (provided they still have to eat, but here also there will remain organic matter to decay long after the last plant has died !). Once a given degree of change of the climate system is over, the net uptake of the terrestrial ecosystems could transform into a net emission. It’s one of the “worse case scenarios” (that I don’t really deeply wish…) that we will tale a look at now.
A worst case scenario: sinks become sources
If we summarize there are today two natural sinks that take back part of the CO2 in excess that we are putting in the atmosphere :
- continental ecosystems, but even unmodified they will remain “small” sinks (they wont be able to remove much more CO2 from the atmosphere than what they do today, and they can’t store a much larger quantity of carbon either : once we have planted trees everywhere we can – and we can’t plant that many – we have done about what we could to enhance this CO2 uptake,
- the oceans.
For terrestrial ecosystems, the soil contains most of the carbon (this is also valid for forests). This carbon is both enclosed in parts of plants of plant remains (roots, dead wood or leaves, humus) and living organisms (microbes, mushrooms, worms…). In a mature ecosystem, the uptake by photosynthesis balances the emissions resulting from the respiration of all the living beings, including those that decay the organic matter in the soil (see above).
With a “small” climate change, both the emissions and the uptake increase. With a “major” climate change, the CO2 uptake due to photosynthesis will decrease – plants and ecosystems will suffer – whereas emissions from the soils will increase (enhanced decay). If the decay increases enough, and/or if the absorption by plants decreases enough (or stops), the ecosystem as a whole can shift from sink to source. The boreal forests, that will particularly heat up, could well follow that evolution, and some fears also exist for the Amazonian forest, where the vegetation could suffer from a local drying up of the climate. It is all the most obvious that in such a case, as we have a process with a positive feedback (some dying forests -> more CO2 in the air -> a higher temperature rise -> even less forests), it is very difficult to know where is the new point of equilibrium, and how much biomass is associated to it.
Another worst case scenario might be associated to a new stock of fossil carbon that has been discovered quite recently under the surface of our planet : methane hydrates. A methane hydrate forms when methane (the principal component of natural gas, and by other means a greenhouse gas) and water meet with low temperatures and a high pressures (this compound is well known of gas companies because it is a pain for gas pipelines in cold regions !).
Methane hydrate is therefore a crystal composed of water and methane, just as ice is a crystal composed of only water. There is no chemical reaction in the formation of this compound, and a simple temperature increase is enough to dissociate the water from the methane. There are two places on Earth where the required conditions for the presence of methane hydrates are naturally met :
- on the ocean floor, provided they are several hundred meters of water above. There is some methane coming from the decay of dead plankton that permanently falls from the surface, it almost freezes – whatever the surface temperature is – and the pressure is high,
- Several hundred meters below the permafrost, that is the soil frozen all year round of the high latitudes (Northern Russia and Northern Canada), because there is also some methane coming from anaerobic bacteria, low temperatures, and high pressures.
A significant temperature rise might trigger a massive release of methane from these reservoirs, though the threshold that must be crossed and the magnitude of the effect are very hard to qualify. It seems that such a massive release – from the ocean floor, in particular – has happened in the past, what would explain part of the sudden variations experienced by the planet during the last glacial age, but it remains a speculative hypothesis.
A significant global warming is also susceptible to slow down the thermohaline currents that go from the surface to the deep ocean, or even to suppress them. As this vertical circulation is necessary to drag efficiently the carbon from the surface ocean – which is a “little sink” – to the deep ocean, where there is the “big sink” (as shown on the figure at the top of this page, the deep and intermediate ocean stores 30 to 40 times more carbon than the surface ocean), one can imagine that without thermohaline circulation, the ocean becomes a marginal sink.
One can now see that there is a risk that sinks – considered as a whole – disappear. If such a thing happened the climte system would be carried away, with an increasing accumulation, self sustained, of greenhouse gases in the atmosphere. Nobody knows what would become of the average temperature in such a case before a new state of equilibrium : could it rise by 10 ° C ? 20 °C ? more ?
A growing number of models now include a coupling between the climate and the carbon cycle in their simulations. Following now is the presentations of the results of two simulations with a coupling between the climate and the carbon cycle. One has been done by the british research center on climatology, the Hadley Centre, and the other one by the French equivalent, the IPSL. Note that neither simulation took into account the possible effect of a temperature rise on methane hydrates.
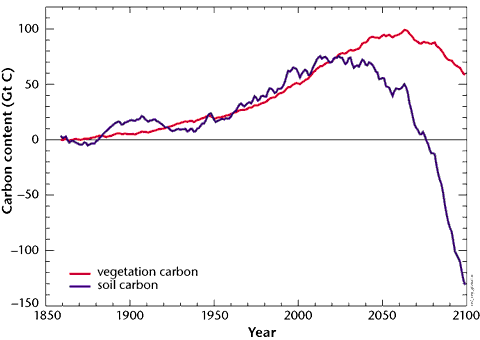
Simulation of the Hadley Centre on the soil carbon content up to 2100, under the effect of a growing climate change.
One can see clearly that soils would switch from sink to source around 2050 (the red curve starts to go down), and that vegetation would do the same 20 years after. The total release of carbon by the soils would reach 200 Gt between 2050 and 2100. The human induced CO2 emissions follow the emission scenario IS92a, which is a scenario “business as usual”, that would lead to 720 ppmv of CO2 in 2100 without the feedbacks of the carbon cycle.
The IPSL experiment yields similar qualitative results.
Source : Hadley Centre, 2001
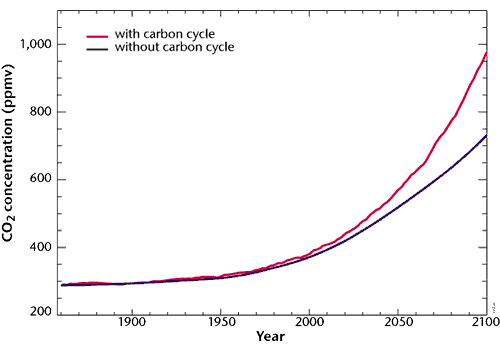
These two curves represent respectively the atmospheric CO2 concentration if we suppose that the absorption capacity of the terrestrial ecosystems remains intact (black curve), and this same concentration if we take into account the weakening of the continental sink then its shifting to source under the effects of climate change (red curve).
In the second case, the CO2 concentration is 30% higher in 2100 (1000 ppmv instead of 760). Human emissions also follow the IPCC IS92a scenario.
The IPSL experiment yields similar qualitative results
Source : Hadley Centre, 2001
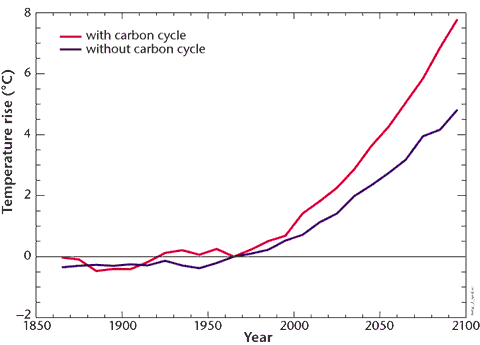
These two curves represent respectively the mean temperature increase if we suppose that the absorption capacity of the terrestrial ecosystems remains intact (black curve), and this same average temperature increase if we take into account the weakening of the continental sink then its shifting to source under the effects of climate change (red curve). Human emissions also follow the IPCC IS92a scenario.
We can notice that taking into account the effects of a changing climate on the carbon cycle induces a significant surplus of temperature increase: from 5 °C in 2100 (high end of the bracket for the IPCC 2007 assessment report) we would go to an 8°C increase (what makes possible a 15 to 20°C increase of the mean temperature over some continental zones, and a 20 to 30 °C rise near the poles).
Here again the IPSL confirms the qualitative results, albeit the temperature increase resulting from the coupling is not as important as in the Hadley experiment, but still with a consequent difference between the values with the feedbacks of the carbon cycle or without.
Source : Hadley Centre, 2001
This fear of seeing terrestrial ecosystems becoming a net source of CO2 has been reinforced by two recent observations made in Europe :
- an evaluation of the impact of the 2003 heat wave on the carbon cycle that year,
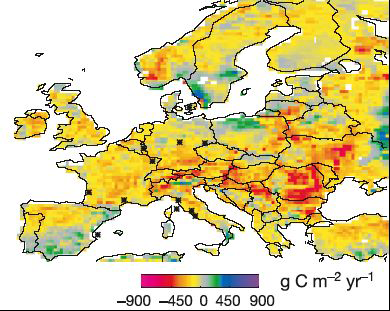
Difference between the average net primary productivity of european ecosystems for a “normal” year, and what took place in 2003. The figure are given in grams of carbon per m2 and per year (that is the weight of carbon taken to the atmosphere through photosynthesis, once deducted what goes back the the atmosphere through respiration of the plants). The reference (“normal”) value is the average for the 1998-2002 period.
This map comes from a simulation, or rather an extrapolation to the whole continent of observation values coming from a numer of places. Red and yellow boxes show the locations where this primary net productivity has decreased in 2003, because of the hydric and heat stress of the plants. Let’s recall that the 2003 summer might be a normal summer in 2050 …
Source : Ciais et al., Nature, september 2005
- An evaluation of the modification of the carbon content of the UK soils in a 30 year time interval :
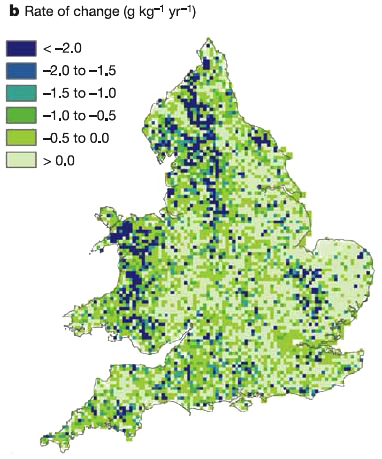
Evolution of the carbon content of the UK soils between 1978 and 2003, in grams of carbon gained or lost each year for one initial kg of carbon content (derived from 3000 samples). Only the zones coloured with the lighter shade of green have increased their carbon content, otherwise the soil has lost carbon..
Over the 1978-2003 time interval, the UK soils have globally lost some carbon, and the magnitude of what they have lost is the same than what the vegetation has gained .
Source : Bellamy et al., Nature, september 2005
It is therefore legitimate to wonder “how far we are from a reversal of the continental sink. If this happens, it is clearly very bad news : we will have put in motion a devilish machine with little visibility on where it will stop…
Venus, a beautiful time bomb
How far could it go, still ? There is near earth an extreme case: Venus, our close neighbour of the solar system. Indeed, this planet, about the same size than Earth, and a little closer to the sun for sure (Venus is 100 million km away from the sun while Earth is 150 million km away), has an atmosphere essentially composed of CO2, which is one of the main greenhouse gases.
If we could “shift” our planet to the orbit of Venus, the ground temperature of Earth would rise from 15 °C to approximatively 50 °C, when the surface temperature of Venus is 420 °C on average, and the surface pressure is 90 bars (equivalent to the pressure under 900 meters of water ; 90 times the pressure on Earth’s surface).
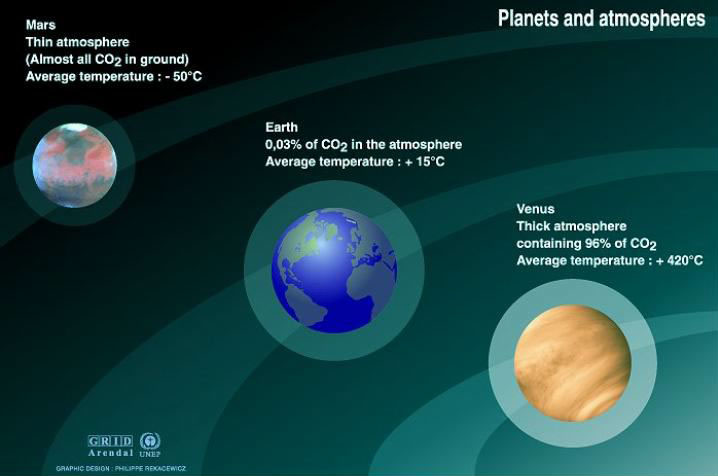
Co2 concentrations and mean atmosphere temperatures of different planets.
Source : Calvin J. Hamilton, Views of the solar system; Bill Arnett, The nine planets, a multmedia tour of the solar system
Nearly all the extra pressure and temperature compared to Earth is a result of the very strong greehouse effect of Venus, and only marginally the result of a smaller distance between Venus and the Sun. Mercury, much closer to the Sun, but that does not have an atmosphere, and thus has no greenhouse effect, has a surface temperature of “only” 200 °C on average.
Hopefully, the average temperature of the Earth cannot rise up to 400 °C as a result of our action ! Such a temperature would require that all the carbon enclosed in lime goes back to atmosphere as CO2, and it is not precisely among the possible evolutions for the times to come. The situation of Venus nevertheless illustrates the fact the the greenhouse effect can be a very mighty “pressure cooker “, and that we should avoid to mess around with the thermostat if we do not want to face a situation where all we can do is witness a predicted catastrophe happen….