If we turn to the past, the answer, without any doubt, is yes. In our modern world based on fossil fuels, it’s been a century now that economic growth and growing greenhouse gases emissions have been strongly coupled.
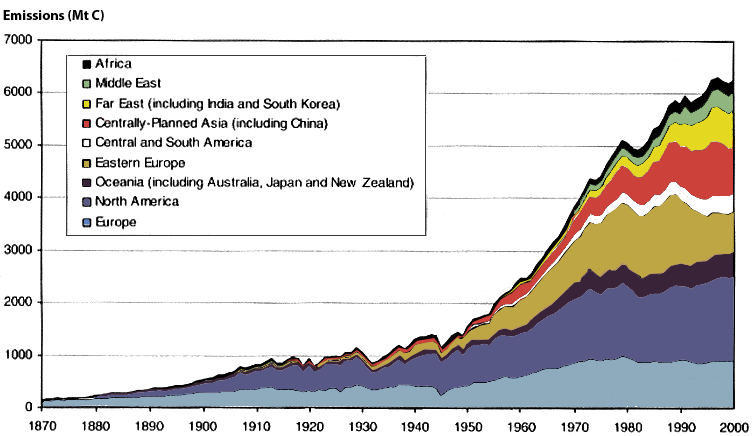
volution of the CO2 emissions coming from fossil fuels, in million tons carbon equivalent.
The only spontaneous decrease of the emissions happen in time of economic crises : in the early Thirties (Great Depression, that saw the world economy shrink by 20% roughly), and after the three economic crises that followed 1974 and 1979 (2 oil shocks), and 1990 (first Gulf War).
On the opposite, the uninterrupted and strong economic growth that happened between 1945 and 1975 goes along with a steady growth of the emissions.
Sources : Marland, G., TA. Boden, and R. J. Andres, 2003. Global, Regional, and National Fossil Fuel CO2 Emissions. In Trends: A Compendium of Data on Global Change. Carbon Dioxide Information Analysis Center, Oak Ridge National Laboratory, U.S. Department of Energy, Oak Ridge, Tenn., United States
If we turn to the future, a simulation done by the French Secretary of State in charge of industry shows that a modest economic growth of 2% per year in Western Europe, in a “business as usual” context, would lead to a 50% increase of the CO2 emissions between 1990 and 2020.
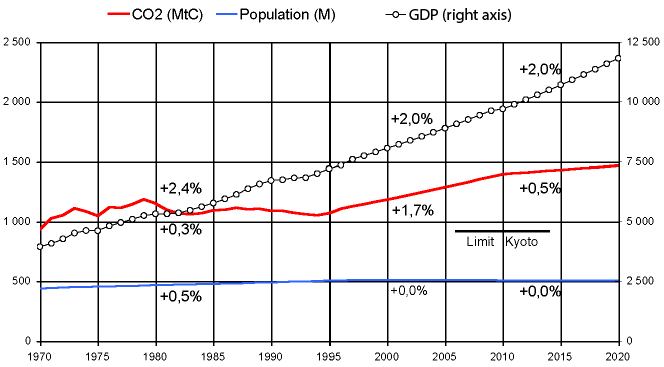
Evolution of CO2 emissions in Western Europe with the hypothesis of a 2% per year economic growth, with no modification of the energy mix
The red curve represents CO2 emissions (in millions tonnes carbon equivalent, left vertical axis) and the short black line (“kyoto limit”, on the right) shows the value below which we should be under the terms of Kyoto (concerning all greenhouse gases, and not only CO2, to be precise) “sometime” between 2008 and 2012 (that is -8% compared to 1990). According to this simulation, the emissions increase by almost 50% between 1995 and 2020.
Source : Observatoire de l’énergie – Ministère de l’Industrie
The outcome of this simulation is actually pretty easy to guess once one knows a certain number of correlations that apply to our productive activities for the time being :
- The outcome of this simulation is actually pretty easy to guess once one knows a certain number of correlations that apply to our productive activities for the time being :
- each percentage point of GDP growth has generated a percentage point of growth of the energy consumption of the transportation sector (in France), and transports use almost exclusively oil products (and more than half the oil consumed in France goes to transportation).
If we prolongate the trends towards the future, “everything remaining equal otherwise”, chances are that economic growth will continue to generate a growth of the energy consumption, and if the breakdown by type of energy, on the world level, remains the same, the greenhouse gases emissions will also increase if the world GDP increases.
The correlation between the primary energy consumption growth and the GDP growth can be seen almost everywhere, for example for the OECD zone between 1970 and 2000, even if it is not a one to one correlation.
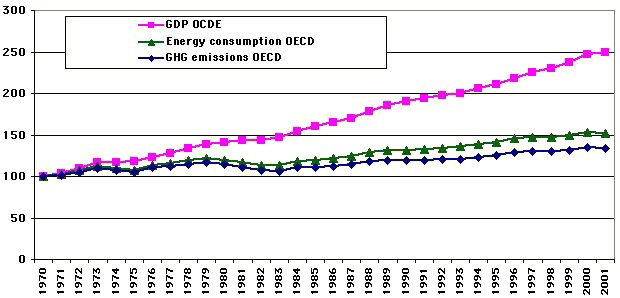
Respective evolutions of the GDP, energy consumption, and greenhouse gases (GHG) emissions of the OECD countries from 1970 to 2001 (normalized : there are all set at 100 in 1970).
For each percentage point of economic growth, the energy consumption increases by half a percentage point, and the greenhouse gases emissions increase by a third of a percentage point. The fact that the energy consumtpion increases slower than the GDP often leads economists to declare that the “efficiency” of the economy increases, but it’s all a matter of point of view : indeed it requires less energy to produce 1000 $ of GDP, but globally the energy consumption still rises !
The transcient decreases of the energy consumption that followed the oil shocks (1973, 1979, and 2000) are clearly visible, and even more the slowdown of the growth of the greenhouse gases emissions, that derived from the construction of nuclear power plants. One will note that at the same time the economy of the OECD zone slowed down but that no major recession happened.
Source : BP Statistical review for the energy, OECD for GDP
As the vast majority of the world energy supply presently comes from fossil fuels, as soon as there is economic growth there is a growth of the greenhouse gases emissions.
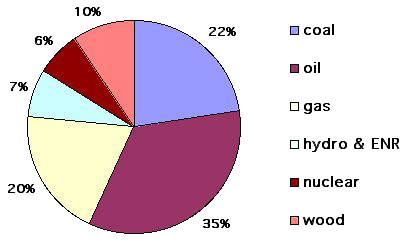
Breakdown by source of the world energy consumption in 2002.
Fossil fuels represent more than three quarters of the total.
Source : IEA.
A first conclusion that can be drawn from what precedes is that if we want to win the battle against climate change, it seems pretty unavoidable to modify the “content of growth”, or to choose to “degrow” for a certain time, at the world level of course.
Isn’t it possible to figure out a “good” growth that might allow to conciliate everything ?
Once it appears that the present “growth” seems hardly compatible with a voluntary solution to the climate change problem, it is of course very tempting to imagine that we will be able to design a “good” growth, that would exist without damaging the environment, because anyone that suggest today to give up growth is easily mistaken for someone that would have had too much vodka (or schnapps or whiskey, I am not specially indebted to Smirnoff). To know whether it is possible or not to find this miracle wedding between economic growth and a preserved environment, we must, unfortunately for those that do not like figures or arid definitions, examine a little closer how this famous economic growth is defined.
Actually, this term refers to the annual increment, expressed in percentage, of the Gross Domestic Product (or GDP), the latter being defined as the economic value (which is the market price most of the time) of the totality of the goods and services produced by resident activities and available for final use (it’s a barbarian definition, you were warned ! But it is preferable to know what we are talking about…).
If we try to explicit every bit of this phrase, here is what it gives :
- resident activities are, more or less, those that physically take place on the territory of the country, no matter whether the capital is held by nationals or foreigners, whether the employee is national or foreign, etc,
- goods and services produced, this is easy to understand ! One should note, however, that in order to have these goods and services accounted for, it is necessary that there is a sale or some monetary exchange of some kind between the production and the consumption (which doesn’t necessarily means that it is the end user that paid the price, but just that “someone” has paid something). That is why all self-production activities, such as keeping one’s kids, growing one’s vegetables, or painting one’s room are nowhere in the GDP. A mother that helps her kid to do his homework will not contribute to the GDP, but if every mother gets paid to help the kid next door to do his homework, while the mother next door gets paid the same amount to come to help the kid at home, then all these commercial exchanges will contribute to the GDP, even while the situation is globally exactely the same. On the other hand, if gardening increases, and a larger fraction of the population grows its own food instead of buying it, this will lead to a decrease of the GDP. More generally, all self-production that would substitute a production previously done by somebody else s mechanically “bad” for the growth.
- at last, available for final use means that these goods or services will not be incorporated in the production of another activity. As a consequence, this “final use” is mostly performed by the households, but it pertains to both spendings on investment goods (like cars and houses) and consumer goods.
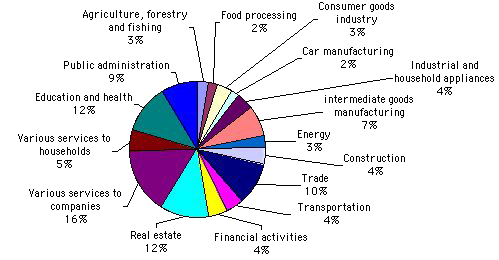
It happens that this GDP caan also be defined as the total added value of the resident activities ; the added value is the difference between the market price of the goods or services sold and the market price of the purchases that are necessary to produce these goods or services, all taxes included in both cases, but less the subsidies given to the producing entities. It is of course possible to calculate a breakdown of the national total by nature of activity, and the following graph gives the example for France, that probably has a structure very close to what it is for most OECD countries.
Now here is a little question : what is it that we may increase, in the above breakdown, without increasing the pressure on the environment, and the greenhouse gases emissions ? And of course the GDP has to increase “in volume”, which means that it cannot be by increasing the prices for a constant production, otherwise we will face inflation, and not economic growth. The difference between the two is supposed to be simple : if the households spend more to buy “the same things” than before, it is inflation, while if they spend more to buy more goods and services, or “different” goods and services, that did not exist before, it is growth.
The difference between growth and inflation can sometimes be subtle : a new 70 horsepower car, ith the same accessories than before, but that has 7 mph extra of maximum speed (which is totally useless in most countries where there are speed limits everywhere), and that costs 5% more, is it inflation or growth ?
Well, here as always, putting things into the right catgory is not always as simple as it seems. If we get back to our question, which is to know what can “grow” in the national economy without having a concomittent growth of the greenhouse gases emissions (and more generally without generating irreversible environmental nuisances of any kind), the answer is far from being obvious :
- can “agriculture, forestry and fishing” (1st item of the above chart) grow “in volume” (that is another way than by increasing the prices, otherwise it is inflation !) without an additional impact on the climate ? Given the number of pollutions of various kinds associated with the existing agriculture (pesticides, eutrophisation, reduction of biodiversity, deforestation, soil erosion, etc), increasing the agricultural output without increasing the pressure on the environment, including greenhouse gases emissions, is certainly not an easy win ! Increasing the total amount of fish captured without increasing the environmental damage does not seem obvious either (and increasing the price of fish while captures would decrease cannot lead to “growth”, but only to inflation !), and at last increasing the number of trees logged (for forestry) without increasing the pressure on the environment (including greenhouse gases emissions) also raises a number of unsolved problems once we get over a given threshold (that we have probably not crossed in France, but I would not swear that it is valid for all countries),
- can the “food processing” item grow in volume without any increase of the “climatic damage” ? Even before we discuss environmental aspects, if the food processing industry produces more goods, for a constant population or so (which is almost the case in OECD countries), it probably means that each individual will eat more, or a more expensive food (the latter generally meaning that it “embodies” more processing, hence more energy, or that the animal protein ratio is higher, hence that the agricultural output or level of capture required is higher). Even if it is an incidental aspect, is it possible to encourage this evolution without aggravated sanitary impacts, such as an increase in obesity ? If we get back to environment, is such an increase of the output of food processing industries (including restaurants) possible without increasing the upstream agricultural output, the latter already being a very significant source of greenhouse gases emissions ? How is it possible to increase the “added value” of what is sold by food processing industries (for example through a multiplication of individual servings) without an increase in the amount of packaging, what does not really contribute to a decrease in the emissions ?
- let’s now shift to the third item of the above graph : car manufacturing. Can this industry “grow” without an increase in the greenhouse gases emissions ? If every new model is smaller, lighter, less powerful, while being more expensive, and not sold in more units, it’s possible, but I doubt that economists will not qualify such an evolution inflation…
- How can we obtain a perpetual growth (because almost no-one envisions a voluntary halt of “growth” in the near future, but almost no-one envisions a voluntary halt of growth “some day” either, whatever remote !) of the economic value of tourism, construction, lintermediate goods, etc, without increasing the greenhouse gases emissions in the short run, and more generally a whole bunch of environmental nuisances in the longer run ? We might scroll down the whole list of sectors mentionned in the chart above, and ask ourself, for each branch of the economy, whether it can “grow” without major inconvenients, or whithout requiring the growth of another branch of the economy that it relies on (like agriculture for food processing, or like transportation for anything which is produced some other place than where it is consumed, or for tourism…). We will come to the conclusion that it will not be so frequent… Even education, considered the fact that it aims at giving people some skills to produce something, relies on the existence of an industrial production !
What this brief listing shows, it is that the “we just have to decorrelate growth from energy consumption” is not so simple, and anyway the economic gowth is, in many cases, not only possible only with an increase in the fossil fuel consumption, but also requires the increase of the consumption of a whole variety of materials, and obviously it cannot last forever. Of course, the stronger the growth, the shorter the time it will last, and that is not valid only for greenhouse gases.
What can be expected from the “dematerialization” of the economy ?
It is quite frequent to hear, however, that the “dematerialization” of the economy will eventually produce the desired result, that is an economic growth that will not automatically generate a growth of the energy consumption (and thus with a growth of the greenhouse gases emissions), and that we can seriously rely on such an evolution in progress to contribute to the solution to the climate change problem.
Before we discuss any further, there remains to give a definition of what is “demateralization” exactly. It is often considered as a growing share of employment that goes into information management, or into office activities, and other “non industrial” economic activities that presently grow faster than the economy itself. Hence, as office activities are believed to be less energy intensive than industrial activities, energy consumption and greenhouse gases emissions would decrease. Unfortunately, such a belief is being hurt by many facts that do not support it :
- An office employee still consumes a lot of energy : his office is heated (or cooled), and he(she) very often uses a car to come to work, and sometimes travels (by car or by place) during office hours. In average, an office employee in France consumes 1,5 tonne oil equivalent per year for his job, that is almost as much as the overall energy consumption per capita of any Frenchman (or woman !) in 1960.
- In particular, a modern office employee consumes much more than a French farmer of 1945 (a third of the active population was employed in agriculture then), or of an employee of a textile factory at the same time.
- For as long as we know, information flows have not substituted physical flows : on the opposite, the two have experienced parallel evolutions, and when the amount of information that goes around decreases, physical transportation decreases too !
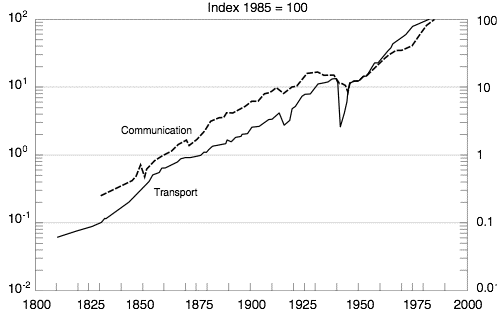
Compared evolutions of information flows and transportation flows since 1800.
No “dematerialization” happened in the past : the increase of the information flows did not avoid a parallel increase of the physical flows.
Source : Arnulf GRÜBLER, the Rise and Fall of Infrastructures, 1990, quoted in Climate Change 2001, Mitigation, IPCC, 2001
- Everywhere in the world the economic growth generates an increased car mileage per individual
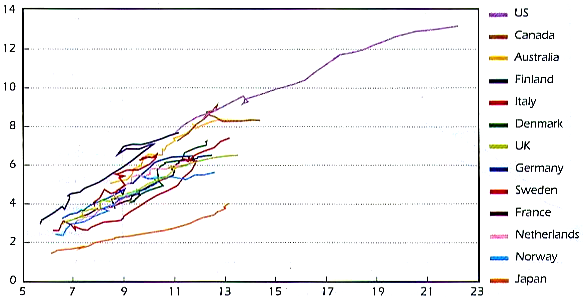
For the 11 IEA countries, evolution, from 1970 to 2000, of the yearly mileage per capita kilométrage annuel en voiture (vertical axis, in thousand vehicles.km per person) versus the purchasing power per individual (horizontal axis, in thousand US $).
The story is clear : the higher purchasing power per individual there is, the more people use cars, or said the other way round, so far, and whatever country is considered, economic growth necessarily means an increased mileage per individual. Well the latter, that belong to the physical world, are bound to decrease someday, as the result of the end of cheap oil, if nothing else. What happens then ?
One will note that still the “slope” of each curve, and its origin, are not exactely the same : between Japan, that has the lowest mileage per unit of purchasing power, and… Denmark, that has the highest (so long for the “environment friendly” reputation of this country !), there is a threefold increase : with the same purchasing power, a Japanese will travel three times less by car than a Dane.
Source : 30 Years of Energy Use in IEA Countries, IEA, 2004.
- a large fraction of office activities aims to increasing the “physical” output : information technologies, consultants, accountants, office and car rentals, or even schools and universities are generally designed so to allow an increase of the industrial or agricultural output, not mentioning their direct energy consumption.
If we try to summarize, we realize that there is no major reason why “dematerialization” should lead to a decrease of the emissions “everything remaining equal otherwise”. It is indeed possible to write the simple equation below (for a step by step building of a similar equation see the page on Kaya’s equation).
GES= \frac{GHG} {Energy}\times \frac{Energy} {GDP}\times \frac{GDP} {active POP}\times {active POP}
This equation means the following :
\text{\scriptsize{GHG emissions}}=\text{\scriptsize{GHG content of energy} }\times \text{\scriptsize{Energy intensity of economy}}\times \text{\scriptsize{Production per employee}}\times \text{\scriptsize{Active population}}
Well “dematerialization” often designates, for some economists, a decrease of the factor “Energy intensity of economy”. It means that for a same amount of GNP produced, we use less energy. But in the same time we generally try very hard to increase productivity (that is the factor “Production per employee”), and to increase the active population (to avoid unemployment and pay the pensions of the retired people!), so that the overall result is not necessarily a decrease of the emissions (that incidentally do not decrease).
In France, the only occasion when such a decrease happened in a period of economic growth was when a majority of electricity production shifted to nuclear, what led to a very significant decrease of the factor “Greenhouse gas content of the energy” that more than balanced the global evolution of all the other factors.
Is “occidental economy” something that can be spread to the whole world ?
If I stick to what can be read most of the time in the paper, and in spite of what preceeds, that shows that the current evolution won’t “fit in the box” for a very long time, our dominant thinking is that it is desirable to spread to the largest population possible the way Europeans live today. What does it mean ? Basically that we consider as a desirable objective that every inhabitant of the planet be gifted with the following goods :
- More than 30 m2 (that is 300 square feet, roughly) of heated – or air conditioned – living space,
- One car per adult able to drive or so (France has over 30 million vehicles today, and a prolongation of trends gives 2 to 3 billion cars on the planet in 2050, compared to roughly 800 million today),
- 100 kg of meat per year (in France, as in many other countries, agriculture is the first source of greenhouse gases),
- 8.000 kWh of electricity per year (it’s about what we consume in France, but only half is directly billed to households, the rest being “included” in the manufactured goods we buy), well electricity generation is the first source of CO2 in the world, because coal and gas account for 2/3 of the primary energy used,
- Manufactured goods in abundance and at low price (cars, buildings, planes, shirts, telephones, drillers, lamps, carpeting, frozen pizzas, in short anything that you can find around you).
An European emits 3 tonnes carbon equivalent per year, in average, to access to this material abundance. Applying this emission to the world population would lead to :
- a threefold increase of the CO2 emissions, that would jump from 6 to 18 billion tonnes carbon equivalent (noted Gtce ; G stands for Giga) per year assuming the population remains constant (the most pessimistic IPCC scenario includes up to 35 Gtce per year in 2100),
- a fivefold increase if, in the same time, the population soars to 10 billion people (CO2 emissions would then reach 30 Gtce/year). Note that if the aim of the game is not to imitate the Europeans, but the Americans, and that we reach 10 billion people on earth, world CO2 emissions would then surge to 10 times what they presently are (that is 60 Gtce per year, something that even the IPCC did not imagine !). It’s true that this begins to be a lot with respect to the known fossil fuel reserves…
