There is not only oil production that will peak someday, before it declines at a rate that is most discussed: gas will experience exactely the same process, for exactly the same reasons than for oil :
- gas was formed in the course of the same process that leads to oil, and thus its stock underground has been given once and for all at the beginning of the industrial era, and there will be no “refill” during the industrial civilization, exactely as for oil,
- and then the same mathematics apply than for oil: gas production cannot increase forever (otherwise the amount of extractible gas would be infinite), and not even remain constant forever (otherwise the amount of extractible gas would also be infinite), but it must – just as for oil – begin at zero (easy to check), end at zero somewhere in the future, and go through a maximum in between. The objects of debate, just as for oil, are the level of the maximum, the date of the maximum, and the decline rate after the peak.
But, to remain in analogies with oil, there is no more “65 years of gas without trouble” than there is “40 years of oil without trouble” ! Depending on the region, the end of a rising gas production will happen between now and in 60 years.
What follows uses the same bases than for oil:
- it is difficult to extract from the ground gas that has not been previously discovered (!), and thus the curve of discoveries will give us the amounts that can be produced “later”,
- to forecast a maximum production, it is necessary to assume an amount for the ultimate reserves (that is the gas that will be produced from beginning to end of the gas era), for which cumulated discoveries is a superior limit, and a general shape for the production curve (which is done with the lag between discoveries and production).
So get to work ! (it will help if you read first the page on the peak for oil production, because the method is the same).
Discover first
As for oil, the peak of gas production will depend first on the total amount of extractible gas, and the only way to have an idea of how much it represents is to discover the said gas. As for oil, the upper limit of extractible gas is simply the cumulated discoveries. Well, for gas as for oil, the maximum of discoveries is… far behind.
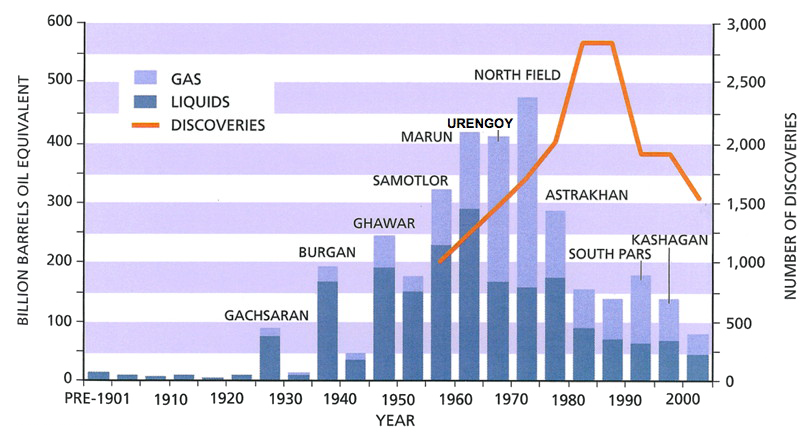
Evolution of the world recoverable oil and gas discoveries (we are talking here of the 2P evaluation, done at the date of discovery), except US and Canada.
The left axis is graduated in billion barrels oil equivalent, and corresponds to the blue bars, that give the volumes discovered for each 5 year period. The right axis is graduated in number of fields discovered, and corresponds to the orange curve that peaks 15 years after the volumes discovered.
As the case may be, the name of the largest field discovered in a 5 year period is mentionned above the bar that corresponds to the same period (for example Burgan and Ghawar are giant oilfields, Urengoy, North Field and South Pars giant gas fields).
The reader will notice two things well known of oil geologists but not as much by the general public:
- It’s been 40 years that we have passed the peak of discoveries for gas (and 50 years for oil), and now the discoveries are way below production (but it does not prevent proven reserves to go on rising, because of other reasons, maybe including… bluff !),
- The number of fields discovered each year is the same today than in the 60’s, but volumes are 4 times lower, which means that the average size of a field discovered is 4 times smaller than then.Source : IHS energy, 2006
Then to be able to position the peak more precisely, it is necessary to have an idea of the average delay between discoveries and production.
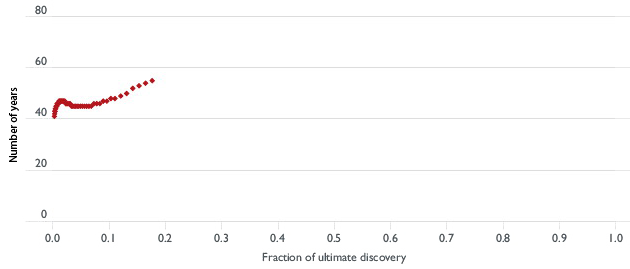
Number of years that separates the discovery of a given fraction of the ultimate reserves and the production of the same fraction of the ultimate reserves (and thus “ultimate discovery” = “ultimate reserves“).
Looking at this graph, we see that 45 years separated the discovery of 10% of the ultimate reserves (which corresponds to the value 0,1 on the horizontal axis) and the production – that is the extraction from the ground – of these 10% of the ultimate reserves. Then 55 years were needed to go from the discovery of 20% of the ultimate reserves and their production. And… for the time being the story ends there, which means that the authors consider that only 20% of the ultimate reserves have been produced at this point.
In other words, 80% of the ultimate reserves remain to be extracted from the ground (provided we don’t care about climate change !).
Source : « Transport energy futures: long-term oil supply trends and projections », Australian Government, Department of Infrastructure, Transport, Regional Development and Local Government, Bureau of Infrastructure, Transport and Regional Economics (BITRE), Canberra (Australia), 2009
Then, just as for oil, we shift from discoveries to production, with of course a future which is not totally written.
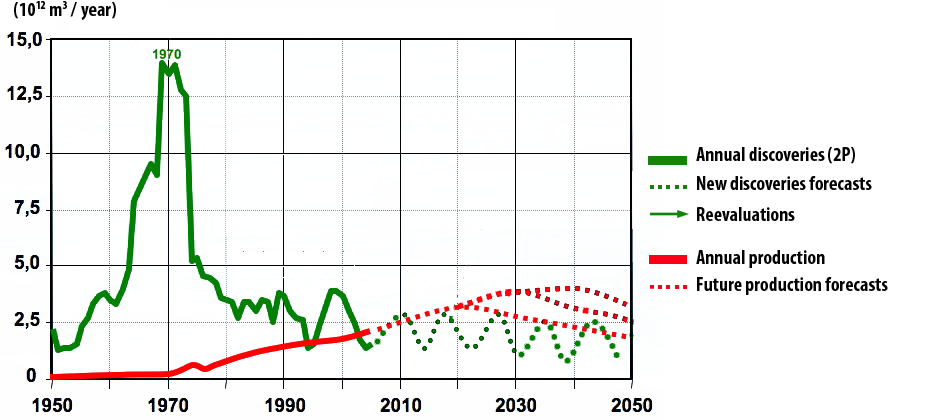
This graph illustrates how to go from world discoveries of gas (in green then in dotted black) to production (in red then in dotted lines of various colours). The vertical axis is graduated in thousand billion cubic metres per year.
The green curve shows the world discoveries of extractible gas since 1950 (source IHS, just as above). The amount reported corresponds to the 2P value, that is the most probable value for the ultimate reserves at the date of discovery of the field.
The red curve shows the world production of gas since 1950, and we see that it does correspond to a cumulated production which is only a small fraction of the cumulated discoveries. What will happen next ?
- For the fields already discovered, technical improvements, better knowledge of the physical characteristics of the reservoir rocks (size, porosity, pressure, etc), and observation of the past production will lead to a constant reappraisal (generally leading to an increase) of the initial production potential of these fields. This effect is illustrated on the graph by the vertical arrows bearing “future reevaluations”. However, for physical reasons, this future reevaluation will be much more modest than for oil.
- Other discoveries will happen, but they won’t represent as much gas as what has already been discovered. Discoveries obey the same law than production: they start at zero, go trough a maximum at some time, then tend to zero, since the overall amount of gas than can be discovered is finite and given once and for all. As for oil, exploration methods lead to discover first the fields that are big, convenient to exploit and close to the surface. Now, when oil and gas companies find big fields, they are generally located in very inconvenient places (arctic conditions, deep offshore, etc).
- Depending on the magnitude of reevaluations and new discoveries, the peak is for “right now” or in one or two decade(s), and will most probably be followed by a plateau lasting 20 to 40 years. In all cases the cumulated gas production will never be larger than the cumulated discoveries of extractible gas.
Source : Yves Mathieu, Institut Français du Pétrole, 2009
Extract, then
As for oil, the second element of debate is the fraction of the resource that will effectively be recovered. Discussions on this “recovery factor” are of course linked to the various opinions on the technical improvements to come, but not as much as it is for oil. In this debate, technicians are traditionally more pessimistic than economists (among other things because economists hate any kind of decline, which is nevertheless something unavoidable when extracting oil or gas from the Earth crust !).
Who thinks what, then ? Let’s start with a French forecast !
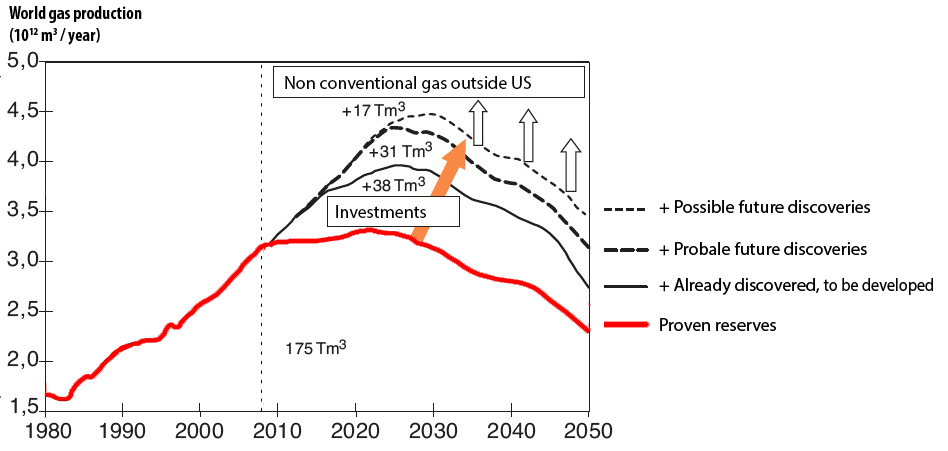
World gas production in thousand billion cubic metres per year (one thousand billion cubic metres of gas ≈ 0,9 billion tonnes oil equivalent).
The curve reproduces the actual production up to 2008, then profiles depending on hypotheses:
- in thick black we have the production if it is limited to the fields already producing: in such a case there is a plateau starting in 2010, ending in 2025, with a fast decline afterwards,
- But some discoveries have not been put in production yet, and besides a mimimum amount of future discoveries is absolutely certain. The contribution of this extra gas will push the production up to 4000 billion cubic metres per year, and increase the cumulated production by 38 000 billion cubic metres. However we will get this gas provided we make (or wish to make if we consider climate change) the corresponding investments to explore and produce.
- Then there are “probable” future discoveries. They correspond to discoveries that are almost certain.
- And at last we have possible future discoveries: it gas we cannot rule out to find and extract, but there we are close to “a lot of luck” (so to say) and not something granted).
The non conventional gas in the US are taken into account on this graph, but not the non conventional outside the US.
Source : Yves Mathieu, Institut Français du Pétrole, Panorama 2010
Another view on the same peak
Of course us Frenchies are not the only ones to make bets on the date of the peak of gas production. As for oil they are fundamentally discriminated by the estimates of ultimate reserves and the speed at which these reserves will be extracted. Below is another forecast made in an Australian report (that has also been used for the page on oil production peak and that can be downloaded by clicking here).
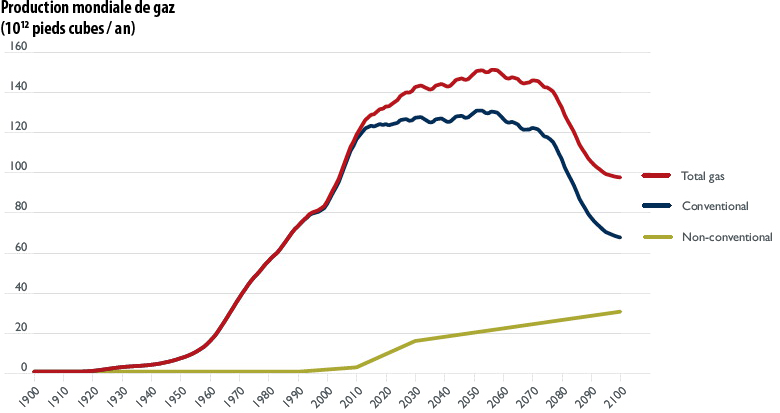
Simulation of the world gas production, in thousand billion cubic feet per year (150,000 thousand billion cubic feet ≈ 4000 thousand billion cubic metres), with a distinction between conventional and non conventional gas.
This simulation gives a maximum in the same range than the one above, but the peak is postponed to 2050 (both simulations share a plateau starting in 2010 for conventional gas).
Source : « Transport energy futures: long-term oil supply trends and projections », Australian Government, Department of Infrastructure, Transport, Regional Development and Local Government, Bureau of Infrastructure, Transport and Regional Economics (BITRE), Canberra (Australia), 2009.
Peak for production… and peak for exports
A major difference between oil and gas is that oil is liquid and gas is gaseous (it took 7 years of graduate studies to be able to come to this statement ! It definitely confirms that it was a good idea to give the taxpayer’s money to the university that trained me). This obvious physical fact will actually lead to a completely different reality regarding international trade. When for oil transportation costs represent 10% to 15% of the production cost (precisely because it is liquid), for gas transporting costs can represent up to ten times the production costs ! (precisely because it is gaseous). This difference prevents gas from being a real world commodity, as only 22% of all gas produced in the world crosses a border between production and consumption, when it is the case for 65% of oil.
As a consequence, gas is more governed by regional markets (the spatial extent of pipes) than a world market (that would require that any gas producer can physically sell to any client in the world, and thus a transportation mostly made with boats, which is not the case for gas when it is for oil). Therefore the gas peak is going to be more a regional fact than a world fact, and it is very consistent with the fact that the price of gas is a regional reality and not a world one.
This does not make forecasts more simple ! For the European Union, that imports 60% of its gas (this percentage falls to 40% if we consider EU 27 and Norway as a single regional unit, which is not totally stupid even though Norway is not part of the European Union).
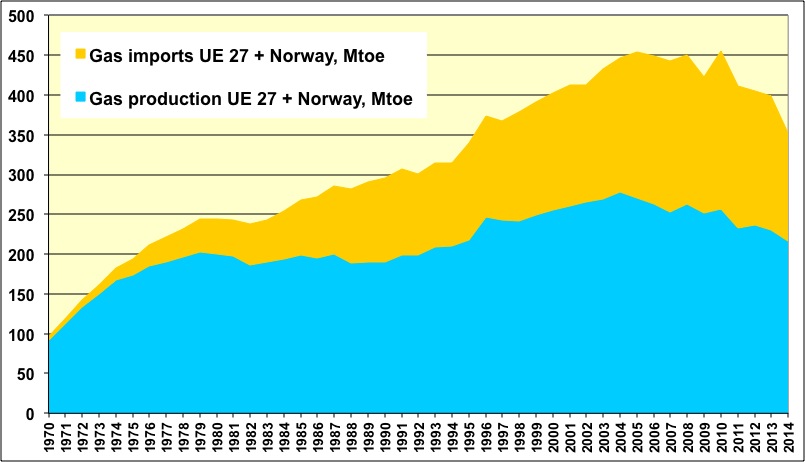
Domestic gas production and imports for geographical Europe (that is European Union + Norway) since 1970.
The North Sea, that presently provides 60% of the European consumption, has passed its peak, and imports will not compensate.
Source : BP Statistical Review, 2013
Where do imports – 40% of the European gas – come from ? Half of these imports come from Russia, so looking carefully at this country is crucial to know whether Europeans will be able to go on heating themselves at “reasonnable” prices. In Russia, there is Gazprom… and the rest: Gazprom represents 85% of the production ! Well this production will probably remain flat at best for the coming decades, as the decline of the fields in production will be at best compensated by the development of new projects (including Yamal). And, of course, the consumer has a different opinion on the future !
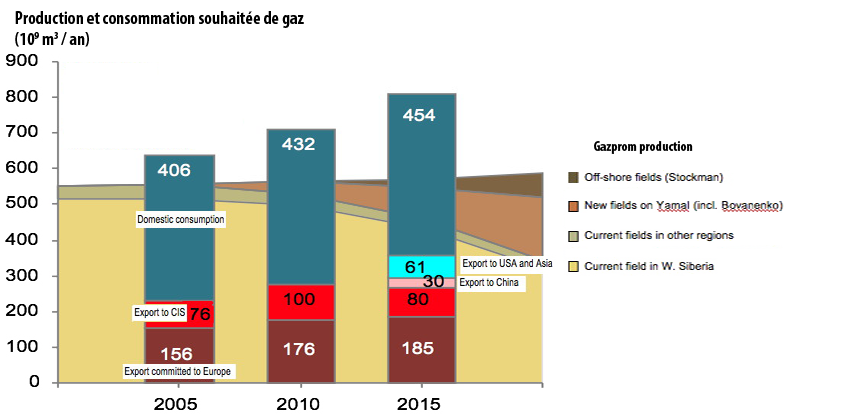
This graph shows the production of Gazprom from 2000 to 2020, with a breakdown by area, and the consumption desired by the customers of Russian gas producers (vertical bars). CIS designates the countries that used to be part of USSR (Ukraine, Kazakhstan, Azerbaidjan, etc).
The development of gas fields in some of these countries (Kazakhstan, Turkmenistan) will lead to less imports from Russia for these countries (which explains why the red area decreases after 2015).
On the production side, one of the biggest challenges is Yamal, a Siberian giant field, and to a lesser extent Stockman. All combined, the production of Gazprom should remain around 550 billion cubic meters per year, while other Russian producers might go from 100 to 200 billion cubic meters per year (that’s the International Energy Agency forecast, and historically their long term production forecasts have been over – even much over – what really happened). Total Russian production should therefore rise from 650 to 750 billion cubic meters per year – at best – by 2020.
Meanwhile, consumers would want to go from 640 to… 810 billion cubic meters per year. There won’t be enough for everyone: there will be a “peak of imports” for someone. Who will be the loser if Europe keeps its imports… and what happens if Europe doesn’t keep them ?
Source : Pierre-René Bauquis, Total Professeurs Associés, 2008
As gas is an addition of regional markets, the rise of non conventional gas in the US – and later on in China and Australia – won’t change much the situation for us Europeans, and it is much likely that our peak gas is… now. It’s time to wake up !