When the press – or anybody expressing himself on the subject – mentions the global temperature increase that the world might experience in 2100 as a consequence of our greenhouse gas emissions, the bracket now mentionned is1,4 to 5,8 °C, and we are accustomed to thinking that this large gap (5,8 °C, that’s almost 4 times1,4 °C !) results only from the imperfect knowledge that scientists have of the climate system and of its future reaction to our behaviour.
If we can’t say wether the increase will be of “only”1,4 °C or of nearly 6 °C in 2100, it’s because our world remains very mysterious : we would be so ignorant of the way marine currents, ice caps, carbon sinks, etc, will behave, that any forecast could only be very speculative. Some “skeptics” do not miss to to invoke such an argument.
Actually, this intuitive conclusion is only partially true, and therefore also partially false. Two main reasons explain this large gap between the two extremities of the bracket :
- Climate models are still failing to take into account all the detailed aspects of clouds. These latter have two antagonist effects on the ground temperature : being composed of water vapour (or droplets) that is a greenhouse gas, they are part of the “heat trap“, but, as they are highly reflexive for the sun rays, they also exert a “cooling effect” on the climate, preventing solar energy to reach the ground. There is no clear consensus on the exact way climate change will modify these two antagonist effects in the future, because clouds are not explicitely taken into account in present climate models (small scale processes responsible for the formation of clouds are not treated one by one, but on a more global scale). This approximative way to represent clouds generates an error range, of course, which is considered to amount to 1 to 2 °C on a prediction for 2100,
- But a second source of fluctuation, that we will adress here, is simply that the state of the world in 2100 not only depends on the amount of greenhouse gases that we already have put in the atmosphere, but also, and mainly, of the amount we are about to put from now on until 2100. And the behaviour to come of humane societes, wise guy who can predict it accurately !
That’s why scientists use emission scenarios, that each describe how greenhouse gases emissions could evolve between 2000 and 2100, depending on various hypothesis. Such scenarios are indispensable to compare between them the results of the various climate models, by looking at what are the different results (depending on the models) with the same hypothesis. Indeed, comparing between them the results obtained with different hypothesis would be a little like comparing the price offers for a vacuum cleaner, a computer and a stove : not much can be concluded then…
As there is an infinite number of possibilities to describe future emissions, scenarios are necessarily conventional. It does not mean, though, that they are totally arbitrary : each of them reflects a plausible state of the future world, meaning that it is not possible, today, to state that one of them is incompatible with the information that we have, even if some of them might seem “extreme”.
These emission scenarios are not designed by climatologists, but by other people (demographs, energy speciaalists, sociologists, economists…). These scenarios neither boast to cover the whole bracket of possible futures, nor propose a hierarchy, that is that the authors of the scenarios refuse to say wether some of them are more certain than others.
Of course, some of these scenarios suppose an availability in fossil fuels that some might consider “over-optimistic”, and others are based on a spreading of nuclear energy that may be considered not realistic, and some others still require a surface covered by forests in 2100 that might seem amazing. The purpose here will not be to discuss the realism of each of the scenarios, because no argument allows to definitely settle this point. I have personally examined them all, and if some hypothesis they assume might seem very audacious today, no scenario can be totally ruled out taken into account what we know of the world.
Practically, the IPCC has published a voluminous book describing the 40 scenarios used, that are grouped in 4 main “famillies”. Each “familly”, named by an abreviation (A1, A2, B1, B2), is supposed to reflect a particular evolution of humanity, and the main hypothesis (concerning demography, agricultural practises, technology spreading, etc) are then turned – through simple models – into energy consumption and food production, the latter being then converted into greenhouse gas emissions.
What’s in the box?
Now, for those who are interested in details, and who are patient enough to read them, here are a couple of characteristics for every main familly, and more detailed information on some scenarios within every familly. All the data is from “Emissions Scenarios, IPCC, 2000″.
The A1 family
The A1 family is based on the following hypothesis :
- economic growth is fast,
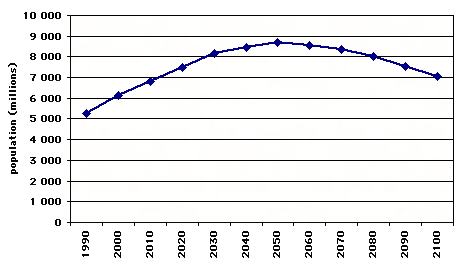
- the world population reaches 9 billion people in 2050 then decreases thereafter (graph below),
- new and efficient technologies are quickly spreading,
- the income per capita and the way of life converge between regions (meaning that Chinese, Indians, and Occidentals all live the same way),
- social and cultural interactions increase heavily (which means that the cultural models are the same for everyone, roughly),
- for the energy mix, there are 3 variants : a massive use of fossil fuels (variant A1FI, “FI” meaning “fossil intensive”) ; a strong call on non fossil sources (variant A1T) ; a “balanced” call on the various energy sources without heavily relying on one in particular.
An example of scenario of the A1FI variant : A1C-MESSAGE
- the average energy consumption per capita in the world rises to 7,8 ton of oil equivalent in 2100 (a ton of oil equivalent – in short toe – is the energy one gets when burning one metric ton of oil ; it is worth 42 billion Joules). That’s 4,9 times the present value, or what an average American consumes today.
- the world fossil fuel consumption rises to 30 billion ton of oil equivalent (in short Btoe) in 2100, 4 times more than today, essentially calling on coal, and the world total energy consumption rises to 55 Btoe, 6 times more than today (diagram below).
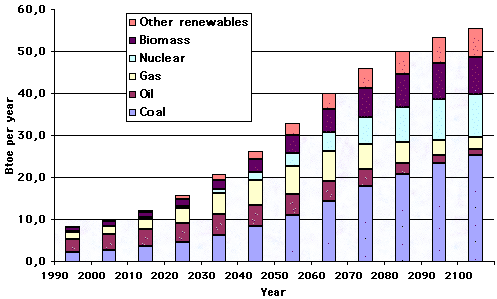
Yearly world consumption in the A1C-MESSAGE scenario
- this scenario leads to a cumulated consumption of 1.152 Btoe of coal, almost twice today’s proven reserves, but a little less of 50% of today’s ultimate resources (a proven reserve is fuel we know is here, and consider that we are able to extract for sure with the present techniques and prices. An ultimate resource is a fossil fuel for wich either the existence and/or the ability to extract it from the ground “one day” remains speculative. More details here).
- This scenario also uses 440 Btoe of oil in a century (ultimate resources are today considered to amount to 450 Btoe, including non conventional oil ; explanations on this page) and 500 Btoe of gas (the ultimate resources are thought to be around 300-400 Btoe, without taking into account the methane hydrates).
- But this scenario also heavily calls on “carbon free” sources : for example, it supposes the existence of 12.000 nuclear reactors of 1400 MWe each in 2100 (for the whole world) ; in 2000 the world total is roughly 400. There is also the need, in this scenario, to use for energy needs – harvesting wood – 75% of the total forests in the world (assuming that the world forest surface remains the same in 2100 as it is today – a bold hypothesis ! – and a net yield of 3 toe per hectare – one hectare = 2,47 acres – and per year).
This scenario remains plausible (nobody can state it is totally impossible) but that describes clearly a very sharp increase of the energy consumption and a world coming close to its known limits for fossil fuels (except for coal). With this scenario, the atmospheric CO2 concentration in 2100 comes close to 1100 ppm, that is 3 times today’s value.
Actually the “plausibility” of this scenario is not really impaired by these consumption figures : with coal alone, if price ceases to be a problem, it probably possible to consume 2000 Btoe in a century, and with breeders is also probably possible to have 12.000 nuclear reactors without resource problems. The “plausibility” to this scenario, in my opinion, is essentially questionned by the fact that it assumes that an ever rising climate change will not significantly impair our productive activities and our demography (otherwise emissions will fall as a result of major troubles), what is the major questionnable point in my opinion, but not necessarily good news !
Source : Emissions Scenarios, IPCC, 2000
An example of scenario of the A1T variant : A1T-MARIA
- the average energy consumption per capita in the world rises to 4,2 ton of oil equivalent in 2100. That’s 3 times the present value, or what an average European consumes today.
- the world fossil fuel consumption rises to 13 Btoe in 2050 (50% more than today), but the world total energy consumption rises to 30 Btoe, a little over 3 times more than today (diagram below).
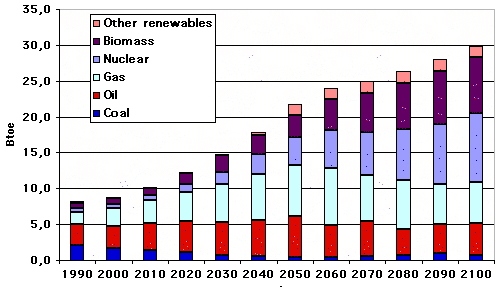
Yearly world consumption in the A1T-MARIA scenario
- this scenario leads to a cumulated consumption of 105 Btoe of coal (20% of today’s proven reserves), 470 Btoe of oil, and 570 Btoe of gas.
- But this scenario also calls on “carbon free” sources in a significant way : it supposes the existence of 11.000 nuclear reactors of 1400 MWe each in 2100, and the use for energy needs of 65% of the total forests in the world (assuming also that the world forest surface remains the same in 2100 as it is today and a net yield of 3 toe per hectare and per year).
So we also have here a scenario which is plausible, but it requires significant additionnal resources in oil and gas compared to what we have now, and, also, a spectacular development of nuclear energy.
With this scenario, the atmospheric concentration in CO2 in 2100 comes close to 570 ppm, a little above 50% more than today.
Source : Emissions Scenarios, IPCC, 2000
The A2 family
If we pursue our “exploration”, the A2 family corresponds to the following hypothesis :
- the world evolves in a very heterogeneous way,
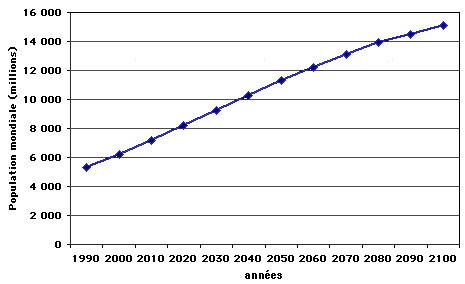
- the world population reaches 15 billion people in 2100, and rising,
- economic growth and the spreading of new efficient technologies are very different depending on the region of the world,
An example of scenario of the A2 familly : A2-MiniCAM
- the average energy consumption per capita in the world rises to 3,1 toe in 2100. That’s 2 times the present value, or what an average Italian consumes today.
- the world fossil fuel consumption rises to 30 Btoe in 2100, 4 times more than today, essentially calling on coal, while the world total energy consumption rises to 45 Btoe, 5 times more than today (diagram below).
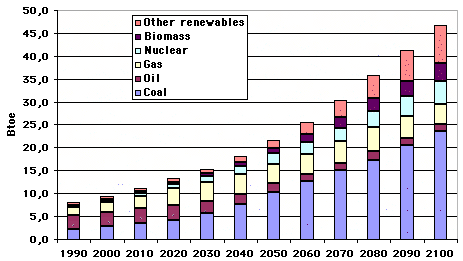
Yearly world consumption in the A2-MiniCAM scenario
- this scenario leads to a cumulated consumption of 1.117 Btoe of coal, or 150% of today’s proven reserves, 262 Btoe of oil (less than today’s ultimate resources, but more than today’s proven reserves), and 438 Btoe of gas (more than today’s ultimate resources).
- This scenario still calls on “carbon free” sources in a significant way : it supposes the existence of 6.000 nuclear reactors of 1400 MWe each in 2100, and the use for energy needs of 30% of the total forests in the world (assuming the same hypthesis than for the previous scenarios).
So we also have here a scenario which is plausible, but it requires significant additionnal resources in oil and gas compared to what we have now, and, also, a spectacular development of nuclear energy.
With this scenario, the atmospheric concentration in CO2 in 2100 comes close to 900 ppm, that’s 2,5 times today’s concentration.
Source : Emissions Scenarios, IPCC, 2000
The B1 family
The B1 family corresponds to the following hypothesis :
- the world population reaches almost 9 billion people in 2050 then decreases (lit’s the same demography than for the A1 family),
- the economy is dominated by services and information technolgies,
- new efficient technologies spread very quickly and are massively used
- adressing economic, social and environmental problems is the baseline of any public policy (nothing much new compared to today, in a way !) but there is no supplementary initiative regarding the climate issue compared to today.
An example of scenario of the B1 familly : B1T-MESSAGE
- the average energy consumption per capita in the world rises to 2,4 toe in 2100. That’s 1,5 times the present value, or what an average Portuguese consumes today.
- the world fossil fuel consumption rises to 12 Btoe in 2050, 30% more than today, before decreasing much below today’s level by 2100 (diagram below).
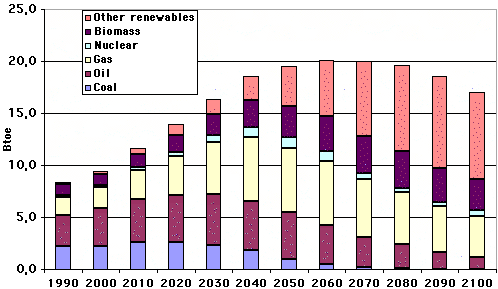
Yearly world consumption in the B1T-MESSAGE scenario
- this scenario leads to a cumulated consumption of 155 Btoe of coal, or 20% of today’s proven reserves, 400 Btoe of oil, and 490 Btoe of gas. The two latter are well above today’s estimates for ultimate resources, but the consumption of coal (that can be turned into synthetic liquid and gazeous hydrocarbons) is well below the simlple proved reserves.
- this scenario “requires” the existence of 600 nuclear reactors of 1400 MWe each in 2100, and the use for energy needs of 25% of the total forests in the world (assuming the same hypthesis than for the previous scenarios).
So we also have here a scenario which is plausible, but it requires significant additionnal resources in oil and gas compared to what we have now, and, also, a spectacular development of nuclear energy.
With this scenario, the atmospheric concentration in CO2 in 2100 comes close to 450 ppm, “only” 20% more than today’s concentration.
Source : Emissions Scenarios, IPCC, 2000
The B2 family
And at last the B2 familly describes a world where:
- the world population reaches more than 10 billion people in 2100, and rising,
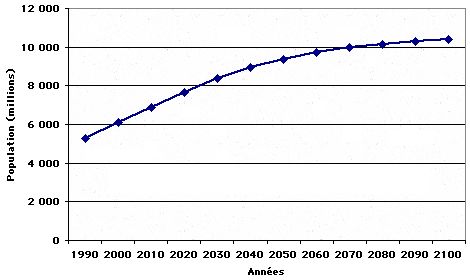
Evolution of the world population in the B2 scenarios
Source : Emissions Scenarios, IPCC, 2000
- the economy becomes more and more local (anti-WTO win !), and, as for the B1 familly, adressing economic, social and environmental problems is the baseline of any public policy but there is no supplementary initiative regarding the climate issue compared to today.
- the dispersion between individual incomes is lower to what it is for A2, but higher to what it is for A1,
- the developping and spreading of new efficient technologies is uneven and goes slower than for B1 or A1.
An example of scenario of the B2 familly : B2-AIM
- the average energy consumption per capita in the world rises to 2,9 toe in 2100. That’s roughly twice what it is today, and a little less than the average consumption of an Italian today.
- the world fossil fuel consumption rises to 18 Btoe in 2050, which is 2,5 times more than today, then remains at the same absolute level, while the global annual energy consumption of the world reaches 30 Btoe by 2100 (a little more than 3 times what it is today).
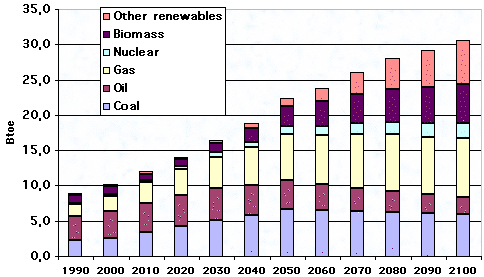
Yearly world consumption in the B2-AIM scenario
- this scenario leads to a cumulated consumption of 570 Btoe of coal (almost all of today’s proven reserves, but only 20% of the ultimate resources), 410 Btoe of oil, and 620 Btoe of gas. The two latter are well above today’s estimates for the ultimate resources (particularly for gas), but the cumulated fossil fuel consumption remains well below the ultimate resources for coal alone.
- With this scenario, it’s roughly 2000 nuclear reactors of 1400 MWe each that would be needed in 2100, and it would be necessary to use for energy needs about 45% of the total forests in the world (assuming the same hypthesis than for the previous scenarios).
So we also have here a scenario which is plausible, but it requires significant additionnal resources in oil and gas compared to what we have now, and, also, a spectacular development of nuclear energy.
With this “gas intensive” scenario, the atmospheric concentration in CO2 in 2100 comes close to 740 ppm, or twice today’s concentration.
Source : Emissions Scenarios, IPCC, 2000
A little synthesis ?
A first conclusion that can be drawn from all this is that none of the scenarios corresponds to a world where halting as quickly as possible human induced climate change is at the forefront of any public policy. It is also essential to note that none of these scenarios envisions a brutal breaking down in the current trends (caused by a nuclear war, a massive outbreak, etc), by nature difficult to predict ! These scenarios represent only various exercices of trend extension, with a couple of elementary parameters adjusted a little lower or a little higher. Some will criticize this way to proceed, but as the future is by nature hypothetical, there is hardly a spare possibility. The most important thing is to know precisely “what’s in the box”, not to discuss wether the box is really among the most probable objects we will face.
A second conclusion is that many of these scenarios imply cumulated consumptions of fossil fuels for the 21st century that are, for some fuels, way above today’s proven reserves. But, on the opposite, there are not that many scenarios for which the cumulated consumption of all fossil fuels goes beyond the ultimate reverves (what is in the ground but that we are not sure to be able to tract one day).
As it cannot be excluded, today, that we might be able to exploit the methane hydrates in the future, or gasify deep coal seams, it is therefore difficult to rule out some scenarios on the sole basis that they are not compatible with today’s proven reserves.
Even though they are in limited numbers, these scenarios lead to very different patterns for the greenhouse gases emissions and concentrations during the coming century, as it can be seen below.

Emissions and concentrations of CO2 for the various reference scenarios (a subset of the 40 scenarios of the 4 famillies), with are used to compare the output of the various climate models. SO2 emissions (SO2 is sulfur dioxyde), which are aerosol precursors (aerosols “cool down” the climate), are also represented. The IS92a scenario is an older scenario that was used for the 1995 IPCC report.
Between the most “optimistic” and the most “pessimistic” of these scenarios, there is :
- a factor 5 regarding CO2 emissions in 2100, which reflects the wide range of hypothesis made on demography, material consumption (that determines energy concumption, except for energy efficiency), the energy mix (that is the proportion of each source in the total), etc
- a factor 2 regarding methane emissions in 2100 (not shown), and a 50% difference regarding the N2O emissions in 2100 (not shown either), a lesser difference being explained by the fact that methane and nitrous protoxyde are mainly linked to agricultural production, that has been considered – by the authors of scenarios – less flexible than industrial production for a given population.
- a factor 3 regarding SO2 emissions in 2100. SO2 is a good marker of local (or “classical”) industrial pollution, and is a aerosol precursor, or a “climate cooler”. It’s interesting to note that the set of scenarios now used, and that were published in 2000, are less “SO2 intensive” than the older IS92a scenario. This lowering is explained by the fact that it has been considered that local pollution will be energetically fought (no bad joke…) everywhere.
As part of the atmospheric CO2 that will be found in the air in 2100 has already been emitted during the 20th century, the difference between the extremes regarding the CO2 concentration is not 5 but 2 “only”. .
Source: Emissions Scenarios, IPCC, 2000
Let’s now come back to the purpose of the top of the page : for a given emission scenario, the various models do not differ by more than 1 to 2 °C for the predicted temperature increase in 2100. The rest of the 4,5 °C difference between the extremes simply reflects the existence of various scenarios, as we can see on the graph below.
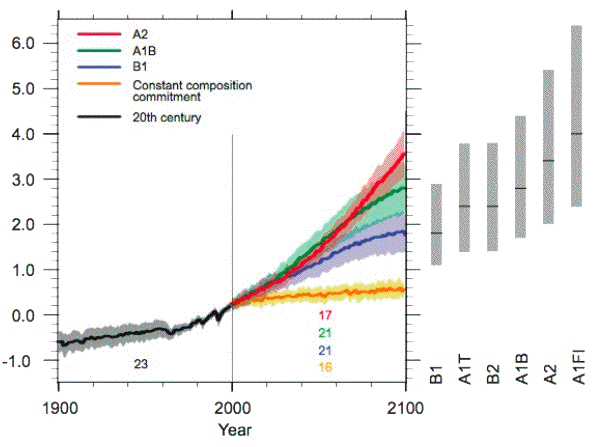
Predictions of the increase of the average near ground air temperature between 1990 et 2100 depending on the scenarios and the climate models.
For a given scenario (represented by an abreviation and attributed a color and a plain or dashed line), the dispersion of the temperature increase predictions depending on the models is shown with a bar on the right hand side, of the color of the scenario.
For example, the A1B scenario, in thick plain red, goes with a temperature increase of 2 to 4°C depending on the models (2 °C between the extremes).
The B2 scenario, in thick plain green, goes with a temperature increase of 1,5 to 2,5°C depending on the models (1 °C between the extremes).
The bar named “all IS92” on the right represents the bracket of temperature increase predictions that were part of the IPCC 1996 report, all scenarios and models together.
Source : Climate Change 2001, the scientific basis IPCC, 2001
The consequence of this fact is that we are still partially the masters of our own destiny. Any reasoning that would consist in thinking “the future being ruined anyway, why make efforts now ?” is therefore flawed : it is still in our hands to “do something” for the long term, even though no result will be instantly visible.
We are in the same situation than a chain smoker : the risk for the future does not disappear the day he(she) quits smoking (as for us the risk of a major climate change does not vanish the day we stop massively emitting), and if he(she) quits Monday but joins again Tuesday, the benefit will be very small (as for us a decrease in the emissions must be long lasting to yield effects).
Only a sustained effort will produce results (just like for a chain smoker), but in the long term the difference might be a major one.
