Article published in Journal de Physique – proceedings, volume 121, January 2005
Abstract
The IPCC emission scenarios have been criticized in the past for their “lack of realism” concerning the cumulated fossil fuel consumption up to 2100 and the pattern of consumption throughout the 21st century they assume. This articles examines briefly to what extent these scenarios are compatible with the data published otherwise by geologists regarding fossil fuels. On the other hand, these scenarios do not include an evolution in which stabilizing the atmospheric CO2 concentration is an explicit goal of the world as a whole. The second part of the article gives some elements regarding the material consumption that such an objective would imply if several billion men remain on earth.
Introduction
Whenever somebody tries to assess the future, even though the future is incertain, a frequent method to proceed is to try to evaluate a lower and a higher end to the possible outcomes of a given evolution for a given deadline. Regarding climate change, it is now pretty well known, not only in the scientific community, that the 2001 IPCC assessment report concluded that the average near ground air temperature could be 1,4 to 5,8 °C higher in 2100 compared to what it was in 1990 [1]. Is it possible to discuss to what extent we are dealing here with the lower end and the higher end of the possible outcomes of the evolution we have put in motion ?
As the reader probably knows, this quantitative result regarding the possible temperature rise throughout the 21st century is obtained by forcing a set of about 15 climate models with rising atmospheric concentrations of greenhouse gases. Many people, in the general public, assume that only one rise of the atmospheric concentration in greenhouse gases is used for all simulations, and thus that the very important bracket between the lower and the higher end of the results reflects only the very different characteristics of the various climate models used, and therefore that the level of confidence regarding the tools that allow to predict a future climate is very low. Insiders know that this is not the case : the hypothesis regarding the atmospheric increase is not the same for the simulation that yields 5,8°C and the one that yields 1,4 °C.
For most future climate simulations, and particularly those that are analyzed in the IPCC assessment report, physicists generally use one of the 40 emissions scenarios that have been designed as a working basis for that purpose, and that are exposed in a special IPCC report [2]. These emission scenarios, grouped in 4 famillies, then allow to model the evolution of atmospheric greenhouse gases concentrations, what also requires hypotheses on the rate at which part of the greenhouse gases are removed from the atmosphere.
Though they are mere hypotheses for climate modellers, emissions scenarios play a dominant role in the temperature rise obtained at after one century of climate simulation, and the general public – it actually starts with the general press – has a hard time understanding that the 21st century temperature rises of the IPCC report are not forecasts in the true sense, but responses of a given set of climatic models to a given set of atmospheric greenhouse gases increases. For a same hypothesis regarding the increase of atmospheric concentrations of greenhouse gases, the difference between the lower and the higher end of the temperature rises for the various models is not of 4,4 °C (difference between 1,4 and 5,8), but rather comprised between 1,5 °C and 2 °C. Thus a discussion on whether the temperature increase might be in the lower end or the higher end of the 1,4 – 5,8 °C bracket must combine two different debates :
- a discussion on the sensitivity of climate models, responsible of a 1,5 to 2 °C difference in 2100 for a given scenario. This discussion is equivalent, in a way, to try to give a specific level of confidence to the various models currently used. As all of them reproduce fairly well the present behaviour of the climate system [1], and as the author has no particular competence in climate modelling, we will not suggest any conclusion on this point,
- a discussion on whether the higher end and the lower end of the emission scenarios accurately reflect the higher end and the lower end of the possible evolutions of demography and way of life, both in developped and developping countries.
This paper has just the modest ambition to suggest a couple of elements pertaining to the second item, and more precisely :
- whether the most “carbon intensive” emission scenarios do comply with what we know of the world otherwise, and in particular whether they are compatible with the data published by energy experts regarding the maximum amount of recoverable fossil fuels,
- if we lower emissions to the point where greenhouse gases concentrations stop to rise, is it possible to deduct a couple of implications regarding our daily life ?
1 – Emissions scenarios : how far can they reasonnably go?
1.1 population
In 2000, the earth population totalled roughly 6 billion human beings. This is definitely a much higher figure than what our planet has experienced for the million years that passed since our species appeared on earth, and it is even tremendously more than what the world population amounted to for the past centuries and millenias before 1900 (graph below) : we were only a couple million human beings when agriculture began its development ; it took 13 years (from 1987 to 2000) to add an additionnal billion to the world population when it took 10.000 years to go from a couple million people to 1 billion.
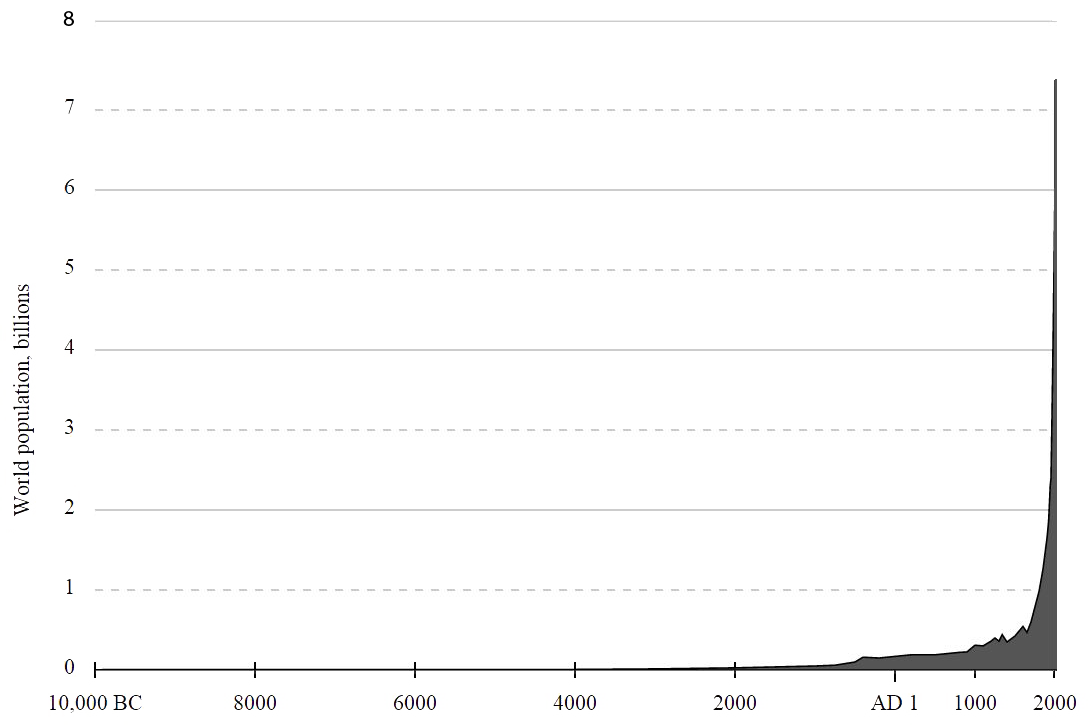
World population evolution since Neolithic times.
There is absolutely no doubt that the pace has brutally accelerated lately, and one can legitimately wonder whether it can be sustained during the next century, because all kinds of negative feedbacks increase with the size of the population. As the present population size is unprecedented, is not possible to turn to the past to decide whether Earth will be able to support for a full century the life of 3 to 9 extra billion human beings, as the emission scenarios rely upon. In fact, it is even not possible to know if our environment could support 6 billion humans beings for a couple centuries (or even one), because even if the population remained stable at 6 billion people, the simple fact that we are seeking perpetual material growth leads to a world which is obvioulsy not at equilibrium, and as long as the situation is not stabilized it is hard to make a reliable forecast.
If we get back to emission scenarios, they rely on 3 demographic scenarios.
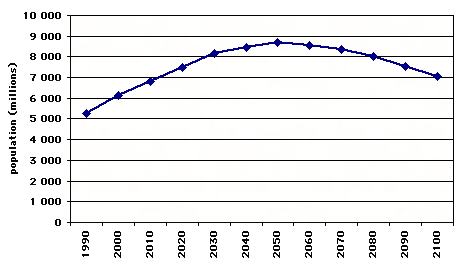
The A1 and B1 famillies (opposite) assume a population growing to 9 billion individuals by 2050, and decreasing afterwards to 7 billion by the end of the 21st century.
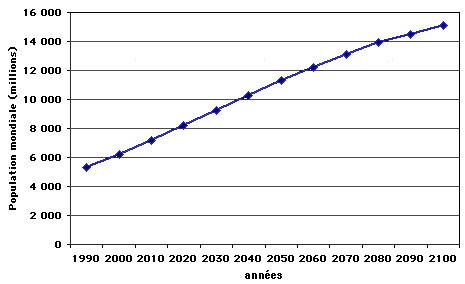
The A2 familly assumes a population growing to 15 billion individuals by 2100, and still rising afterwards (opposite).
And at last the B2 familly assumes a population growing to more than 10 billion individuals by 2100, and still rising afterwards, though slower than for the A2 familly (opposite).

The B2 familly assumes a population growing to 10 billion individuals by 2100, and still rising afterwards (opposite).
All scenarios thus assume that the world population will remain more numerous – and sometimes much more numerous ! – than what it was during the 20th century. If we look a little closer at the figures, the comparison is as follows :
Average population during the 20st century in billion men
Average population during the 20st century : 3 billion men
- For A1 and B1 scenarios : 7,8 billion men
- For A2 scenario : 10,9 billion men
- For B2 scenario : 8,9 billion men
In other words, all scenarios assume that Earth can sustain for a full century a population at least 2,5 times more important, on average, than what it was during the 20th century. Apart from the implications on energy, that we will examine below, one can wonder if it is compatible with the possibilities regarding agricultural output, water, wood, various ores, etc., especially if we assume that the consumption per individual will also increase by a 2 to 5 ratio. One might then wonder why, if the idea is to work on a full set of plausible evolutions, regardless of whether they are considered as desirable or morally acceptable, a sharp decline of the population – that can’t be ruled out, especially as a consequence of a major outbreak – has not been enclosed in the evolutions assessed.
Here is just one example : as climate change is supposed to favour the spreading polewards of all kinds of vector borne diseases, increase floodings that sometimes cause major outbreaks, increase heat waves, exert a negative pressure on crops after a certain threshold, etc, to what extent are the above demographic evolutions compatible with the possible sanitary consequences of climate change that will occur in the 21st century, to begin with ? But the reader will note that assuming that these scenarios are unlikely is not necessarily good news : a sharp decline of the population resulting from major outbreaks is not at all a pleasant prospective. However, if we stick to the climate change problem, it might definitely change its magnitude.
1.2 fossil fuels
All emission scenarios assume given amounts of consumption throughout the 21st century for oil, gas, and coal. The first question that comes to mind is of course to know whether the cumulative consumption over the 21st century induced by each scenario is compatible with the remaining extractible resources. What “remains to extract” from the ground can bear various names depending on the category it belongs to :
- proven reserves correspond to amounts that operators declare as being already able to extract from the know physical resources, with the known techniques and in the present economic conditions,
- additional reserves correspond to the extractible fraction of future discoveries, plus the additional fraction of known resources that operators consider as not extractible today but most likely extractible in a near or remote future, plus the fraction considered as likely to be extracted from the reevaluation of the physical resources already discovered.
In the oil industry, which has developped a sophisticated approach to qualify and evaluate those additional reserves, these are broken down in two categories : probable and possible, that each correspond to a different level of probability regarding future availability. Comparing cumulative consumptions for the 21st century to the sole proven reserves declared in 2000 is therefore of little use, since these proven reserves correspond to a fraction only of what remains to extract. A much more useful notion for our purpose is that of “ultimate reserves”. For any fossil fuel, ultimate reserves designate all the fuel that will (or can) be extracted from the beginning to the end of the said fuel era. Ultimate reserves therefore correspond to the sum of the cumulative consumption up to now (that definitely has been extracted), proven reserves, and additional reserves. Remaining ultimate reserves represents the same amount, less what has already been consumed (hence remaining ultimate is the sum of proven and additionnal reserves, or all that can be extracted in the future, near or remote).
The energy unit that most people use when discussing the future consumption is the tonne oil equivalent, or toe, and its multiples. 1 toe is worth 42 billion joules, in rough figures (or 11600 kWh), and to give two important magnitudes :
- in 2000, the world consumed roughly 10 Gtoe (billion toe) of primary energy (of which 1 of non commercial energy, mostly wood, the rest being oil, gas, coal, nuclear energy, and hydroelectricity),
- that year, a European or a Japanese consumed roughly 4 toe, while an American consumed roughly twice that amount.
Since the beginning of the oil era, there have always been attempts to estimate the oil ultimate reserves for the world, in spite of the difficulties attached to this kind of calculation. Indeed, there is no public dataset, easily accessible, and cross-examined by various parties, that would give an exhaustive view of the world oil resources (resources generally designate what is enclosed in the ground, and their magnitude obviously conditions the discussion on ultimate reserves). Besides, such an estimates necessarily requires an hypothesis on the average extraction ratio of the resource, now and later, which mainly rely on expert’s opinions. Therefore various experts or companies publish their own estimates for ultimate reserves, deducted from the information they can access. The graph below represents the results of almost 100 published results from 1970 onwards [3].
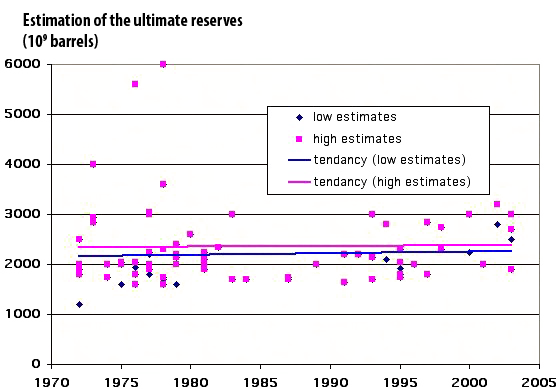
Published estimates of the ultimate reserves, from 1970 onwards, in billion barels
(1 tonne = roughly 7 barrels).
For each estimate we have reported the higher and the lower end of the bracket. There is no clear tendancy to an increase – or a decrease – of the median value of the estimates since 1970, that remains around 2500 billion barrels, or 350 Gtoe in rough figures (the most optimistic evaluations have been made just after 1975 and not later !).
We also note a narrowing with time of the difference between “optimistic” and “pessimistic” estimates.
Source : [3]
If we trust these experts, ultimate reserves for conventional oil are therefore limited to 360 Gtoe, from which we should deduct 130 Gtoe of oil already consumed before 2000, what leaves about 230 Gtoe for the remaining ultimate that year. A significant reevaluation of this figure in the future could derive either from important future discoveries, or from a significant increase of the extraction ratio in the future, or from a significant reevaluation of the amount of resources already discovered. Of course, any of those should happen while being yet unforeseen, because all future events that are predictable (like a probable increase in the extraction ratio of conventional oil because of new techniques under develoment) are taken into account in the calculation of ultimate reserves.
If we stick to discoveries, for example, the probability of major ones “later on” does not seem very likely, given the decline observed since 1960, in spite of the various oil shocks that each time enhanced prospection efforts (graph below).
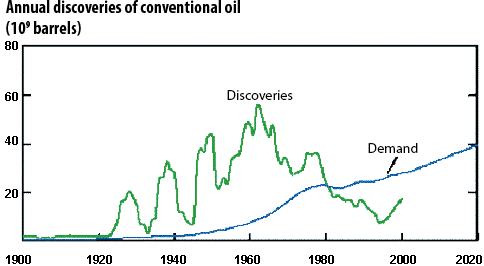
Annual discoveries of conventional oil, in billion barrels, and world annual consumption (or demand) of oil products (in billion barrels also).
The left curve refers to all oil discovered below the ground, not the fraction that we will extract, that will be notably inferior.
Source : Exxon Mobil, 2002
The other possible sources of ultimate reserves reevaluation are limited : the extraction ratio will never jump to 100%, because an oil reservoir is not a fuel tank, but a porous stone impregnated with oil, and if the pores are very small and the oil very sticky there is a “physical adversity” that technology cannot do much about. Otherwise, the reevaluation of known physical resources decreases with time because as the years pass by there is more and more available data on the ultimate potential of the already known oilfields. So increasing the remaining ultimate reserves by 30% is debatable, but that they could be multiplied by 2 or more seems very unlikely.
Apart from what is called “conventional oil reserves”, that is reservoirs in which oil is fluid, there are also unconventionnal oil resources : bituminous sands, shale oil, etc, but the “oil” we refer to in this case is actually closer to coal or bitumen regarding its physical properties. So it is not possible to extrapolate the present extraction ratio of conventional oil (which is currently around 35%) to unconventional oil, because it is unlikely that this oil will be as easy to extract as the conventional one. As estimates for unconventional oil resources in the ground (deep offshore, extra-heavy crude, bituminous sands) currently amount to 600 Gtoe [10] [11], a conservative extraction ratio of 20% would mean an additional 100 Gtoe to ultimate reserves of oil, hence leading to a total for oil of 330 Gtoe of remaining ultimate reserves, that we will round to 350 Gtoe approximatively.
A first interesting exercise if then to confront the total oil consumption in the scenarios to this figure (graph below) : only four scenarios “pass the test” of leading to a cumulated oil consumption in 2100 below the ultimate reserves.
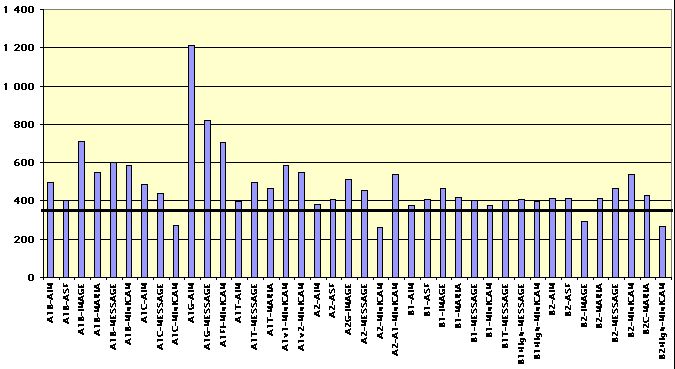
Cumulated oil consumption for the 21st century for the 40 SRES scenarios, in Gtoe (vertical axis).
Only 4 lead to a cumulated oil consumption that is below the median estimates of the remaining ultimate reserves, that is 350 Gtoe (horizontal thick bar).
Source : [2]
In addition to the existence of a superior limit for the cumulated consumption, geologists have noticed another rule that oil extraction must approximatively follow, which is a correlation between the curve decribing the discoveries and the curve describing the production. Indeed, it has been observed on most oil basins that the production figures evolve along a curve that approximatively reproduces the curve of discoveries with a constant time shift. As in most parts of the world – and for the world as a whole, as noted above – the curve representing discoveries is more or less bell-shaped, it means that the production curve will also be more or less bell shaped. An example is given below for the continental part of the US (excluding Alsaka and Hawai).
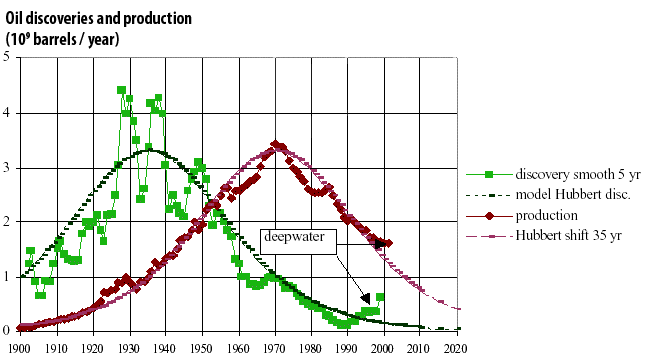
Left curve with green squares : oil discoveries in the continental USA, in billion barrels, from 1900 onwards, smoothed (5 year mobile average).
The rythm of discoveries can be approximatively modelled by a gaussian curve (named “model Hubbert discoveries”, because King Hubbert, an Amercian geologist, was the first to notice this).
Right curve with rombus (production) : annual oil production in the continental USA, in billion barrels. The gaussian curve shifted by 35 years is also represented.
We observe that it almost perfectly fits the production curve. In other words, a good approximation of the production curve can be obtained by shifting the gaussian modelling the discoveries by a constant time lag.
Source : [6]
A consequence of the general shape of the theoretical production curve is that, as it is symetric, the production peaks when half the ultimate reserves have been extracted. Stated the other way round, the production cannot grow much once half the ultimate reserves have been consumed. This general shape has been observed on many oil basins that are beyond their production peak [4].
So if we consider that such a bell shaped curve is also a reasonnable approximation for the world oil production, then we cannot have, in an emission scenario, an oil consumption still rising after half the world ultimate reserves have been consumed, more or less. As half of the median estimate of the ultimate reserves, including unconventional oil, represents about 230 Gtoe, of which 130 have already been consumed in 2000, it means than no scenario can assume an oil consumption still rising much after an additional 100 Gtoe have been consumed.
It happens that very few scenarios meet this constraint for oil if we calculate the cumulated consumption before peak from the statistical tables of [2] : with remaining ultimate reserves of 350 Gtoe, only 7 (out of 40) comply ; it would require remaining ultimate reserves to be pushed up to 450 Gtoe to have 50% of the scenarios comply with this rule, and over 2500 Gtoe – which is way over all the oil physically present in minable reservoirs, including non conventional – to have all of them comply with this rule.
The same reasoning can be applied to gas and coal, with a major difference, which is that ultimate reserves of gas and coal are much less frequently assessed than ultimate reserves for oil : few publications give estimations of the world ultimate reserves for these two fuels. Another difference, due to geological reasons, is that the production curve might well not be symetric for gas, because once the pressure starts to fall (leading to a decline in production), there is not much remaining in the reservoir and the decline is fast. In addition, for gas, the value chosen for ultimate reserves primarily depend on the hypothesis made regarding the possibility to ever recover a fraction of methane hydrates that are supposed to constitute part of the upper layer of sediments below the ocean floor.
Today, the published data allows neither to definitely and absolutely rule out that it will be possible to call on hydrates one day, nor possible to prove that we will ever find a significant minable deposit on the sea floor, as it is not yet the case. However, ultimate reserves generally enclose all resources that we consider as probably extractible “someday”, on the basis of technological progress, or on the basis of distribution laws regarding fossil fuel deposits (what allows to estimate the “remaining to discover”). In the light of the published data, there is no such warranty that we will ever discover commercially minable deposists of hydrates someday. Putting them into the ultimate reserves is therefore debatable.
Gas proven reserves amount to roughly 140 Gtoe, and additional reserves estimates remain below 150 Gtoe in most cases. For non conventional gas (like coal bed methane), proven reserves, that is fuels that are readily minable in the present economic and technical conditions, are very low : several Gtoe only [5]. Again, whether hydrates or aquifer gas will ever be extractible one day remains an object of debate, because it has not been establihed yet that there exists significant concentrated deposits somewhere [4]. Therefore a reasonnable estimate regarding remaining ultimate reserves might be set at 350 Gtoe, and no more than 150 Gtoe (roughly) can be consumed before the peak. That leaves aside 39 scenarios (out of 40) that assume over 150 Gtoe of gas consumption before the peak. Remaining ultimate reserves should be pushed up to 500 Gtoe to get 5 compatible scenarios, to 900 Gtoe to get 20 compatible scenarios, and close to 3000 Gtoe for the full set of scenarios to be compatible with a bell shaped consumption pattern.
In other words, regarding gas all scenarios assume that a considerable increase in the ultimate reserves will occur, which means that those scenarios assume that considerable amounts of hydrates will be minable within a couple decades. Indeed, regarding conventional gas the discoveries haved peaked in the 1970’s, what makes a sudden surge in discoveries of conventional gas debatable, and, as the standard extraction ratio is already of 80% (for conventional gas), not much of an increase is to be expected from there.
For coal, commonly published figures regarding reserves amount to 500 Gtoe (coal and lignite), but the resource base is much larger, and evolves between 2800 and 4300 Gtoe for the recent years, with the important limit that it seems that only one organism made a world assessment of the coal resources [7]. If we stick to technological considerations, it is not easy to decide of an upper limit for additional reserves from the resource base. Techniques that allow to access coal resources do not consist only in digging : in particular deep coal can be gasified, what turns coal seams, in a way, into a special kind of gasfield.
Given the techniques already available, and the net energy balance of coal mining or gasification, that remains positive in most cases, we cannot exclude that a very significant fraction of the resource base gets recoverable if prices get high enough. If we assume an amount of remaining ultimate reserves of 2500 Gtoe for coal, then 35 scenarios comply with a bell shaped consumption curve for their coal part. It appears that the estimates published by technical or professional institutes and the assumptions used in the scenarios are much more compatible regarding coal than they are for oil or gas.
A first conclusion is that if we consider that the breakdown between fossil fuels, in emissions scenarios, is an essential point, then it is quite clear that most of these scenarios are not likely : for oil and gas they assume consumptions that are not in accordance with the estimates published otherwise regarding remaining ultimate reserves.
But we might also consider only the aggregate of all fossil fuels, on the assumption that they can be substituted one by another : coal can be liquefied to obtain synthetic fuels (it has been the case in Germany during World War 2, or in South Africa), or can be “gasified”, and in turn gas can be also transformed into synthetic fuels. So we might redo the exercise by considering that what matters is the global consumption of fossil fuels, and “eliminate” scenarios that would assume a fossil fuel consumption still rising after more than half the ultimate reserves of the global aggregate (coal+oil+gas) have been used.
If we want to explore the higher end of the bracket, we might also move a little upwards the oil and gas ultimate reserves, still complying with some figures published by technical institutes, to 450 Gtoe each (or rather 900 Gtoe for the total). If the coal ultimates reserves amount to 2500 Gtoe, hence leading to 3400 Gtoe of aggregated fossil fuels ultimate reserves, then 15 scenarios are possible regarding the cumulated fossil fuel consumption before peak. The higher one of that particular series (B2C-MARIA) leads to cumulated emissions roughly equal to 1350 Gtc (on the basis of 1,12 tC/toe for coal, 0,83 tC/toe for oil and and 0,65 tC/toe for gas).
The resulting atmospheric CO2 concentration would be in the 800 ppm range in 2100, depending on the uptake from oceans and continental ecosystems during the 21st century. Whether we assume a constant uptake of 4 tC/year from 2000 to 2100, or a proportional uptake of 40% of the emissions during that period, which are definitely two simple – maybe simplistic – hypotheses, the result is about the same. If coal ultimate reserves amount to 4000 Gtoe, hence leading to 4900 Gtoe of aggregated fossil fuels ultimate reserves, then 36 scenarios (out of 40) become possible, with CO2 concentrations in the 900-1200 ppm range in 2100, depending on the rate of uptake.
A preliminary conclusion of this short analysis of scenarios in the light of available data regarding fossil fuel ressources is that, if we assume that the present data is of the good magnitude regarding the ultimate reserves, the “most extreme” scenarios (such as A1C-AIM or A1FI-MiniCam) do not seem very plausible (for the fossil fuel aspect), even if they cannot be definitely ruled out. Still, the higher end of what is not impossible given the known data on fossil fuel occurrences in the ground, that leads to 1000 ppm more or less, remains very worrying. The increase in atmospheric CO2 associated to the higher end of the plausible scenarios is still enough to lead to a major climate change, that is a couple degrees increase in a century to start with.
So it appears that the short term “menace” of a shortage in the production of conventional oil, that represents roughly 40% of the world energy supply today, and that could indeed lead to a major disruption of the socioeconomic system, is not exclusive of major trouble linked to climate change later on, if after the oil and gas peak humanity progressively but massively shifts to coal. Sequestration of CO2 emissions in this case would not cover diffuse sources (light industry, transportation, heating) and the rate of spreading for intensive sources remains unknown, since today there are only several prototypes operating .
1.3 nuclear energy
These emissions scenarios also assume a contribution of nuclear energy. Though using nuclear energy has no direct effect on greenhouse gases emissions, it has an indirect effect, as it allows to have a higher economic growth without calling more on fossil fuels (because the overall energy input into the productive activities increase). The statistical tables of [2] give the amount of “primary energy” coming from nuclear energy for the various scenarios. It is unclear whether the contribution refers to the electric output or to the thermal input, that is the thermal power developped inside the reactor (which is currently three times the electric output).
We assumed that the figure refers to the electric output, because it is the most common usage, and calculated the number of reactors that are required to produce this output, assuming a reactor operates 7500 hours per year (on a total of 8.760), and has a nominal electric power of 1400 MW.
The implications of the various scenarios for the number of reactors in 2100 are represented on the following graph (for a comparison basis, the world has today roughly 450 nuclear reactors, but 40.000 large dams, the contributions of hydro and nuclear being equivalent).
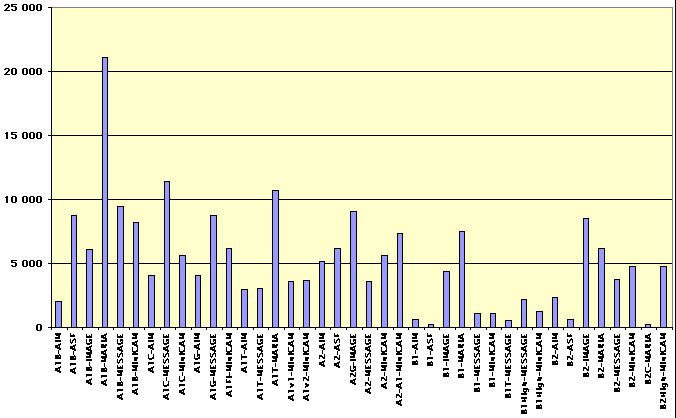
Number of nuclear reactors in 2100 for the 40 SRES scenarios.
(A nuclear power plant generally has 4 reactors).
If the scenarios mean “thermal input” and not “electric output”, the above figures should be divided by 3. Whatever hypothesis is priviledged, the scenarios that envision a number of reactors above several thousands assume that breeders emerge, because developping such a number of reactors with the present fission of U235 is not compatible with the amount of recoverable U235 on earth, even with much increased ore prices. Ultimate reserves for uranium 235 are estimated at 6 million tonnes [5], that is a little above 500 Gtoe.
This figure excludes the oceanic content, but the dilution rate in seawater is such that obtaining a significant flow of U235 from the ocean remains speculative at the moment. A 1400 MW reactor uses 2,7 Mtoe of uranium per year (primary energy), which means that with 4.000 reactors, all U235 ultimate reserves are consumed in 50 years, hence the above conclusion on breeders : with such reactors, the ultimate uranium reserves would allow approximately 2500 years of functionning for several thousand plants.
1.4 biomass
The scenarios also include a contribution of biomass. The same kind of preliminary remark than for nuclear energy can be made : renewable biomass does not directely contributes to increasing atmospheric CO2 concentration. It has, however, direct effects on the aerosols emissions, and an indirect effect on the tropospheric ozone concentration (ozone being a greenhouse gas), hence on the radiative budget of the atmosphere. It also has an indirect effect on the consumption of fossil fuels. In addition, all biomass use is not presently renewable, because part comes from deforestation, so biomass use has an effect on land-use change, which is a direct contributor to CO2 emissions.
With a couple of simple hypotheses, we can calculate the proportion of emerged land that must be devoted to obtaining renewable biomass for energy use in 2100 for the various scenarios. First we assumed an average primary productivity of managed ecosystems of 7 tonnes of dry matter per hectare and per year. Most exploited forest on earth have primary productivities in the 4-10 tonnes of dry matter per hectare and per year range [6] [9]. We recall to the reader that if the biomass undergoes any processing before use (which is the case for biofuels), only the net energy output per hectare can be considered, after the intermediate consumptions (machinery, distillation, fertilizer manufacturing, etc) have been deducted.
We also assumed an energetic value of 0,5 toe per tonne of dry matter, that is a primary productivity of 3,5 toe per hectare on average for the whole world. The results in the graph below are given in percentage of the present forests devoted to biomass production for energy use in 2100, and for a comparison basis we should remember that forests presently occupy a rough 30% of emerged land. We should also keep in mind that there is a pressure towards a diminution of this surface because of demographic growth. This pressure should logically increase when scenarios envision a multiplication by 1,5 to 2,5 of the present population.
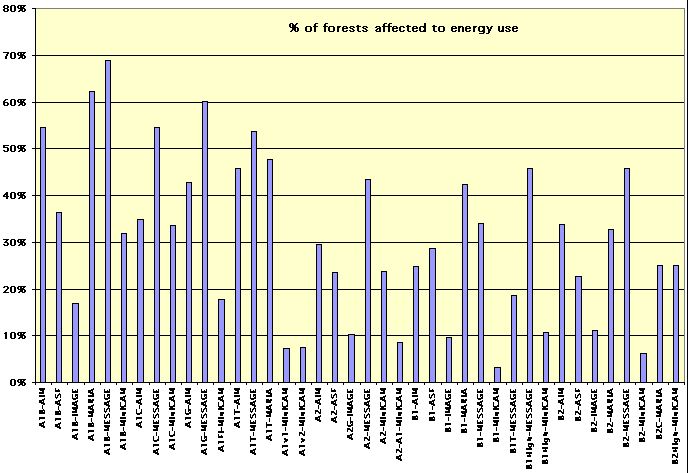
Percentage of the present forest surface devoted to energy use in 2100 in the various scenarios, with the above described hypothesis.
It appears that some scenarios of the A1 group are definitely very “extreme”, assuming that half the forests – or an equivalent surface – get devoted to getting energy. The author has no objective limit to suggest on the fraction of present forests that can reasonnably be used for energy use, but still this seems very (too ?) high, especially with a growing population as assumed in the scenarios.
1.5 Premiminary conclusion
This quick examination of emission scenarios yields the preliminary conclusion that the higher end of the bracket of these scenarios is probably very unlikely, though they can’t be ruled out as absolutely impossible. The unlikely aspect of the extreme scenarios does not dismiss the climate change problem, as some possible “modified medium scenarios”, with an energy consumption or population that would not rise as quickly as assumed, but that would call massively on coal after oil becomes expensive, still bear a very significant menace, in the sense that they still lead to a couple degrees increase in the known simulations [1]. In addition, one should recall that the temperature rises exposed in the 2001 IPCC assessment report do not take into account some potentially potent feedbacks, that might cause a transient acceleration of an initial climate change only driven by anthropogenic emissions :
- the feedback of the carbon cycle, that might add one to several degrees at the end of the 21st century with a “medium-high” scenario regarding anthropogenic emissions, that remains within the “reasonnable” limits assessed here [1] [7],
- the possible melting of part of the permafrost [1], that might turn part of the boreal tundras into vast swamps that would emit methane, or that would release large – but unassessable – quantities of methane previously trapped below the permafrost.
If it were possible, it would be ideal to couple climate models with emission scenarios models, the latter being themselves coupled to ultimate reserves estimates. Depletion of fossil fuel reserves would then exert a feedback on the availability of energy, hence on the emissions. Such a coupling would probably allow an interesting cooperation between the climate scientists and the energy engineers.
2 – Decreasing the emissions : how far should we go ?
We can now discuss the other extremity of the bracket, though no emission scenario corresponds to that objective, which is what we should do to stop the increase of the greenhouse gases concentrations in the atmosphere. The rest of the paper will consider only the case of CO2.
To stop to enrich the atmosphere in carbon dioxide, the principle is very simple : the human induced emissions must remain below the uptake of the “carbon sinks” (oceans for one part, continental ecosystems for the remainder). But this uptake is not constant with time, and follows a couple of simple rules :
- for the continental part, it increases with the atmospheric concentration of CO2 : an atmosphere that contains more CO2 favours, in the short term (that is before any major modification of the climate happens), the primary productivity of ecosystems in place,
- for the oceanic part, the uptake also increases with the atmospheric concentration of CO2 : the amount of CO2 that dissolves in sea water increases if the air contains more CO2 (the partial pressures of CO2 in the air and in the water come to an equilibrium : if it increases in the air, it increases in the ocean also),
- but, for continental sinks as for oceanic sinks, this absorption decreases with temperature : oceanic water dissolves less CO2 when warmer, and in a warmer climate the primary productivity increase (if it remains) compensates less and less an accelerated decomposition of the soil carbon, that puts back CO2 in the atmosphere [1].
The consequence of the latter is that a given level of CO2 emissions, that allows to achieve instant stabilization of the CO2 concentration at a given time, will become excessive later on to keep the CO2 concentration constant, because the uptake will have weakened as temperature gets higher, while emissions will have remained the same. Hence the “good level” below which we should remain regarding the CO2 emissions to achieve stabilization evolves – and decreases – with time.
For the discussion that follows we will choose a first order approximation, which actually sets up an upper limit to the emissions. Today, the world anthropogenic CO2 emissions represent roughly twice the total uptake (ocean plus continental ecosystems). Hence a minimum objective that is meaningful in regard of this physical fact is that the world must divide its CO2 emissions by 2, or bring the CO2 emissions down to 3 billion tons of carbon per year.
Practically, what does it mean for you and me to emit only 3 billion tons of carbon per year ? 3 billion tons of carbon for 6 billion human beings represents, equitably allocated, 500 kg of carbon per person and per year, or (with respect to 1998 figures) :
- less that 10% of the present CO2 emissions of an American or an Australian (Americans shoud therefore divide their emissions by more than 10 to achieve their share of stabilization of CO2 in the atmosphere),
- Between 15 and 20% of the emissions of a German or a Dane, that should therefore divide their emissions by 6 to achieve their share of stabilization,
- 20% of the emissions of a Briton ; individual emissions in Great Britain shoud therefore be divided by 5,
- about 25% of the emissions of a French or a Swiss (or a Swede), which means that a division by 4 is required here,
- roughly 30% of the emissions of a Portuguese, for whom a division by 3 is then the objective,
- roughly 50% of the emissions of a Mexicain : this country is already emitting twice too much for a voluntary stabilization of CO2 in the air,
- already 60% of the emissions of a Chinese, which means that this country, as “poor” as it may be considered, is already 40% too “rich” as far as CO2 emissions are concerned,
- But 120% of the emission of an Indian, twice that of a Pakistanese, and 20 times that of a Nepalese : some countries would still have the possibility to emit a little more…
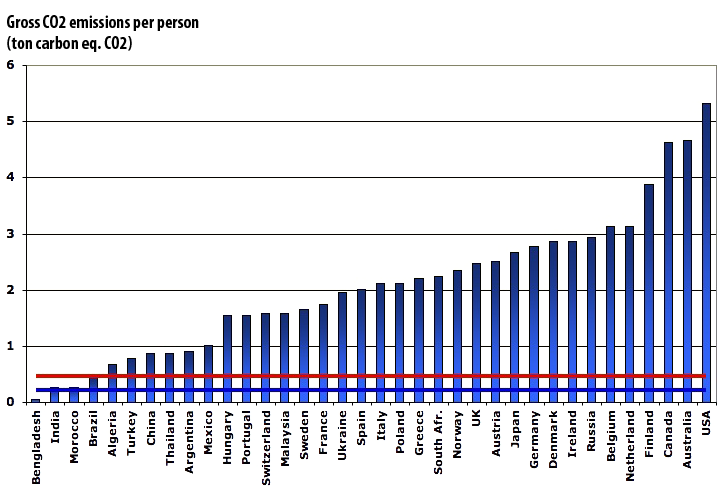
Comparison between the gross CO2 emissions per person in 2004.
Dark blue line : “maximum allocation” of 500 kg carbon equivalent per person and per year, which is the goal if we want to divide the CO2 emissions by two, assuming we remain 6 billion people on earth.
Dark red line : “maximum allocation” per person and per year if the goal must actually be to divide the CO2 emissions by three, assuming we become 9 billion people on earth.
With the technologies currently in use, this “maximum allowance to emit without harming the climate” (of 500 kg carbon equivalent of CO2), is reached as soon as we have done just one of the following :
- flown a return trip from New York to Paris,
- used 3,200 kWh electricity in Great Britain (or 3,000 kWh in the US), but as much as 22.000 kWh in France or Sweden, because of the amount of “carbon free” electricity generation in theses countries, knowing that each French consumes around 6.700 kWh per year
- today (of which more than 50% is “invisible” to the individual, because it is electricity “embodied” in the manufacturing of the various goods that we buy, including food products).
- bought 50 to 500 kg of manufactured products (that is the third of a subcompact car, but much less if there is a lot of electronics or rare materials).
- bought one and a half computer with an LCD screen,
- used 2 tons of cement (a modern house of 100 m2 – roughly 1000 square feet – requires 10 tons),
- driven 5.000 km – that is 3100 miles, roughly – in urban trafic in a small subcompact car, that is 6 months of driving – on average – of a Paris inhabitant,
- driven, still in urban trafic, only 1,500 km – less that 1,000 miles – in a SUV or 4×4 or Hummer or any gas-guzzler alike,
- used 1.000 m³ (that is roughly 30.000 cubic feet, or 36.000.000 million BTU) of natural gas (that it a couple months of heating of a house).
Those figures are derived from [8].
Some readers might consider that, given what it means to achieve volontary stabilization, it will never happen : though the majority of what is decribed in the above list is only 50 years old at most, some people consider that doing without – or with much less – equals going back to the stone age. The author would like to stress that, in a finite world, the alternative to the absence of voluntary stabilization is not a rise forever, but a stabilization that will be achieved without our consent, through feedbacks that we might appreciate much less than the efforts we should accept to achieve volontarily stabilization.
Indeed, the fact that the emissions must equal the uptake “some day” is “not negociable”, because the CO2 concentration in the atmosphere cannot keep rising indefinitely. In addition, the global amount of fossil fuels we can burn is limited, and the surface of forests we can clear is also limited. As the cumulated emissions coming from fossil fuel use and land clearing have an upper limit, it is also certain that anthropogenic emissions can only tend to zero – on average – with time, hence there is a mathematical certainty that “one day” the world emissions will decrease below half the present level.
The only good question is thus the following one : do we choose to decrease voluntarily greenhouse gases emissions, or do we try to follow the path of ascending emissions as long as possible, waiting for non wished events to perform the decrease for us “later on”, implicitely accepting, then, that it happens in conditions that we might not control, and which might be very unpleasant ?
References
[1] Houghton et al., Climate Change 2001, The Scientific basis, Cambridge University Press, 2001
[2] Nakinovic et al., Emissions Scenarios, A special report of WGIII of the Intergovernmental Panel on Climate Change, Cambridge University Press, 2000
[3] ASPO Second international workshop on oil & gas, Paris, May 26-27 2003
[4] Jean Laherrere, Estimates of Oil Reserves, Paper presented at the EMF/IEA/IEW meeting, IIASA, Laxenburg, Austria – June 19, 2001
[5] Reserves, Resources and Availability of Energy Resources 2002, Federal Institute for Geosciences and Natural Resources, Hannover
[6] Watson et al, IPCC Special Report on Land Use, Land-Use Change And Forestry, Cambridge University Press, 2000
[7] Dufresne, J.L., Friedlingstein, P., Berthelot, M., Bopp, L., Ciais, P., Fairhead, L., Le Treut, H. & Monfray, P., 2002. On the magnitude of the positive feedback between future climate change and the carbone cycle. Geophysical Research Letters, 29(10).
[8] Jancovici, JM, Carbon Inventory for Industrial, Commercial and Office Activities, Methodological Background, Ademe, 2001-2004
[9] Good Practice Guidance for Land Use, Land-Use Change and Forestry, IPCC National Greenhouse Gas Inventories Programme, in press
[10] Bauquis, PR, What future for extra-heavy oil and bitumen : the Orenoco case, 17th World energy Congress, Huston, Sept. 1998
[11] Bauquis, PR, A reapraisal of energy supply and demand in 2050, Oil & Gas Science and Technology (revue de l’Institut Français du Pétrole), vol. 56 N° 4, pp 389 – 402, 2001