Poor hydroelectricity: it is not often quoted when discussing renewable electricity, though in 2012 it produced 8 times more electrons than wind. It is, and by large, the first source of renewable electricity in the world. And though, it seems not likely at all that one day most of our electricity comes from dams, at least at the present level of electricity consumption.
Dams and dams
There are more than 40 000 dams higher than 15 meters built in the world (source: World Commission on Dams), and, in this total, China alone has more than 50%, and then India has more than 5% (which is still more than 2 000 dams). Why do we build dams? Stupid question, one might think: to produce electricity is an obvious answer. Well, it is not quite so: for a large number of countries, the firsst reason to build dams is to irrigate crops, with no electricity production associated. In Asia, 2/3 of the 10 000 dams of the region have been built for irrigation only, without the slightest turbine in it.
But there are of course multi-purpose dams, that are used both as a reservoir for irrigation, and for electricity production. In such a case, there are sometimes use conflicts between farmers and electricity consumers, because both want the water at different times! The farmers want water in the summer, when electricity consumption (in France) is low, when the utility that operates the dams (EDF for example) wants to keep the water for winter use, when there is the highest peak demand.
Before we go any further, it is essential to get rid of a common idea: that most dams include a lake. Indeed, reservoir dams – those with an artificial lake- provide the most precious electricity, that which is available within minutes when demand rises fast.
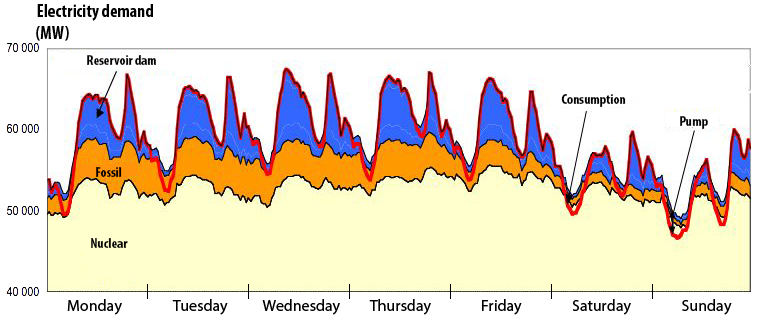
This graph shows, for a typical winter week in France, the electricity demand (red curve), in GW, and the various means used for supply, which correspond to the coloured areas.
Light yellow: nuclear
Orange: conventional thermal (coal and gas, mainly)
Blue: hydroelectricity.
Wind is neglected.
This graph shows a couple of interesting things:
- Though it is primarily build for baseload, nuclear contrbutes also to peak demand: we see a daily modulation of output,
- conventional thermal is used for semi-baseload, at the week scale, but not at the hour scale
- what is really the main contributor to peak demand is hydroelectricity, that can add up to 12 GW (or 15% of the total) almost instantaneously..
Source: EDF
As a dam lake can generally not sustain a permanent use all year round, those units do not operate full time. They are primarily used to adjust production and demand, and this adjustment can cross borders, as it is often the case in Europe (for example Norvegian and Swiss dams contribute to the peak demand in other countries). Over a year, that counts 8 760 hours, a dam will be in use for 1000 to 2000 hours.
But there is a second category of dams, called “run of river”. They use all year long waterfalls of small height (a couple meters) created in the course of large rivers. These dams produce all year long, and therefore provide baseload electricity, and not peak electricity (it is not flexible as reservoir dams).
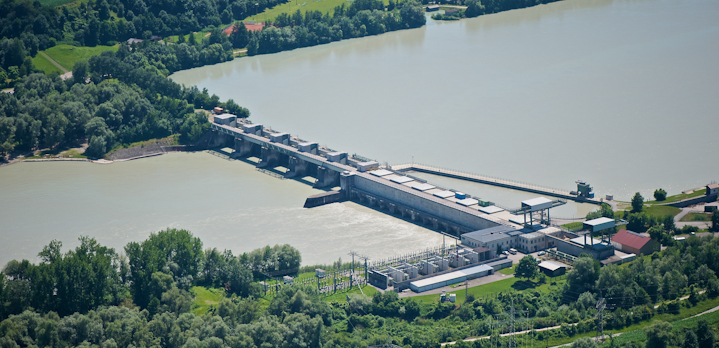
Example of a run of river dam.
The turbines are in the dam itself.
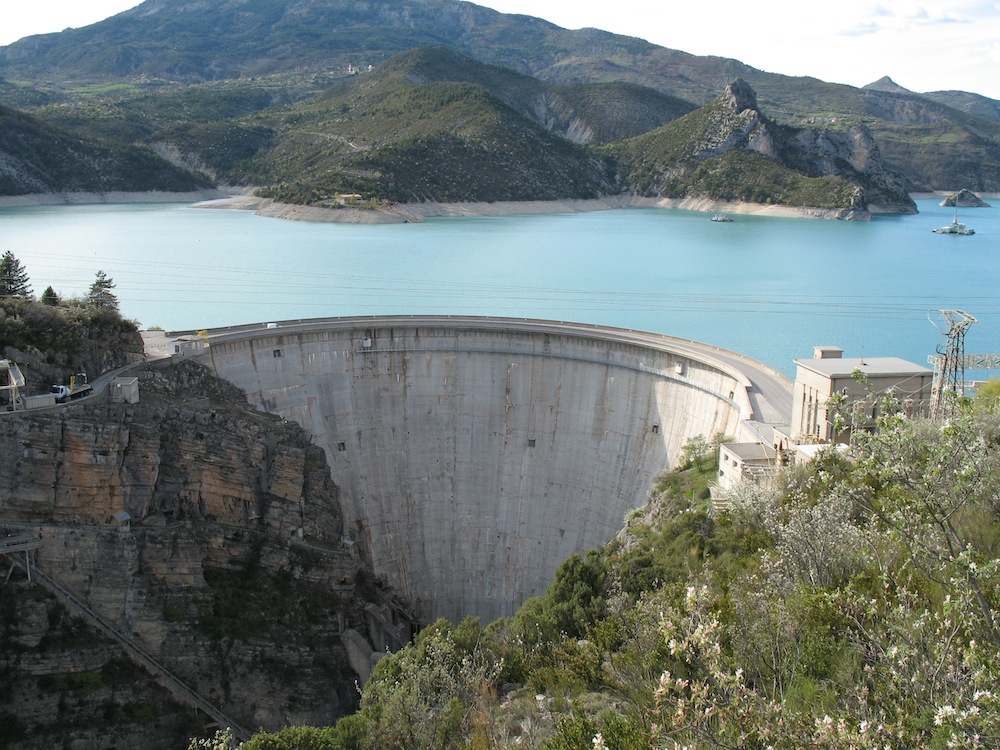
Example of a reservoir dam.
The turbines are in the dam itself.
There is a third category of dams: pumping stations, or waterworks. They are “reversible dams”, that produce electricity from a waterfall, or pump water up into a reservoir dam, depending on the situation.
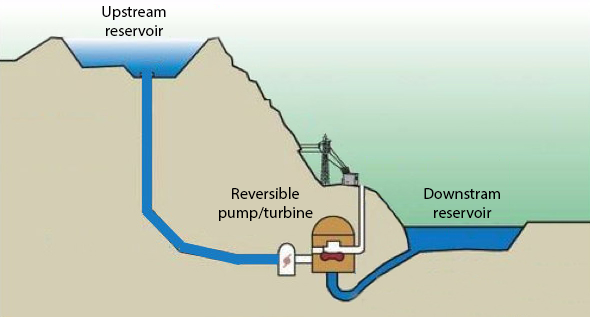
Basic principle of a pumping station.
The system is composed of two dams, one above a pump/turbine, and one below. When there is plenty of extra electricity on the grid (off peak hours) and the upstream basin is not full, a pump (using electricity from the grid) lifts water from the downstream reservoir to the upstream one.
During peak hours, the opposite is done: water falls from the upstream reservoir, puts a turbine into motion, which will produce electricity. If the downstream reservoir has a lower capacity than the upstream one, the system is both a regular dam and a pumping station.
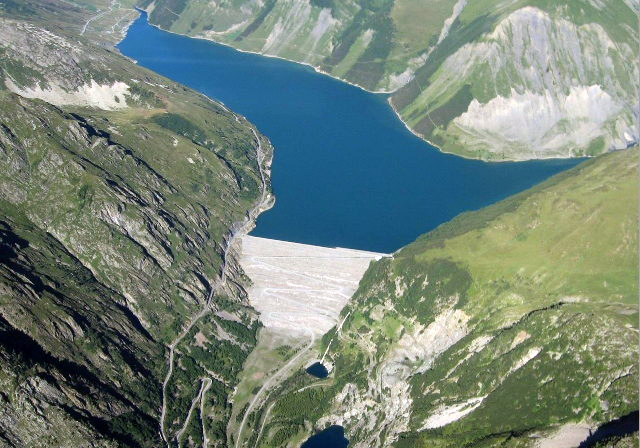
The Grand Maison pumping station, in France.
The upstream reservoir is the lake on top, and the downstream reservoir a lake 900 m lower, not shown on the picture.
Source : EDF / Photography : Patrick de Goumoëns
The figures that are given for the hydroelectric production of a country aggregates all types of dams, and therefore do not allow to guess what proportion is flexible power, and what proportion is baseload power.
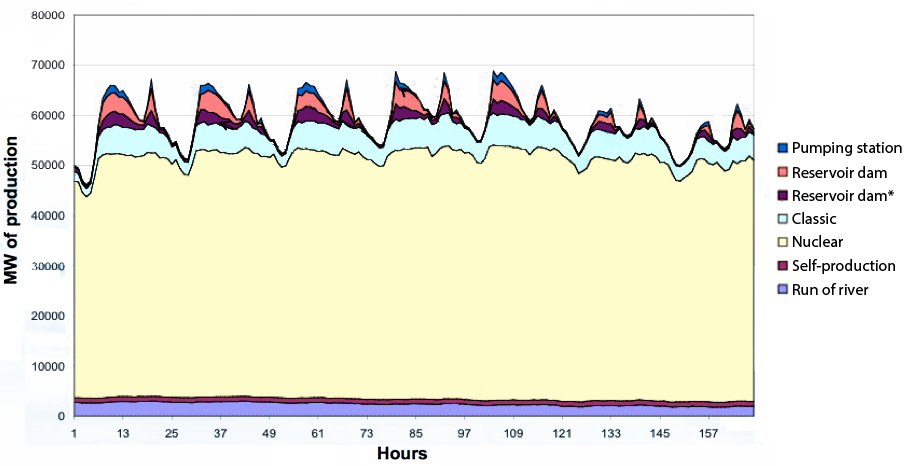
Hourly production of a typical winter week in France.
* medium height waterfall
We can, see the contribution of the various types of hydropower:
- run of river is at the bottom and produces all the time
- various reservoir dams (with a breakdown between medium height and high height waterfalls) are used for peak demand only, as well as puping stations used as dams.
- nuclear and conventional thermal provide the bulk (nuclear mainly).
With all the types of dams, hydroelectricity provides roughly 15% of the world electricity, or 6% of the world energy supply in primary equivalent (that is the amount of fossil fuels that would be necessary to produce the same amount of electricity). This proportion (of hydro into the total electricity generation) is of course very variable depending on the country, and can go from zero (for flat countries) to close to 100% when the country has plenty of mountains and a low density of population (Norway, Iceland, Brazil…).
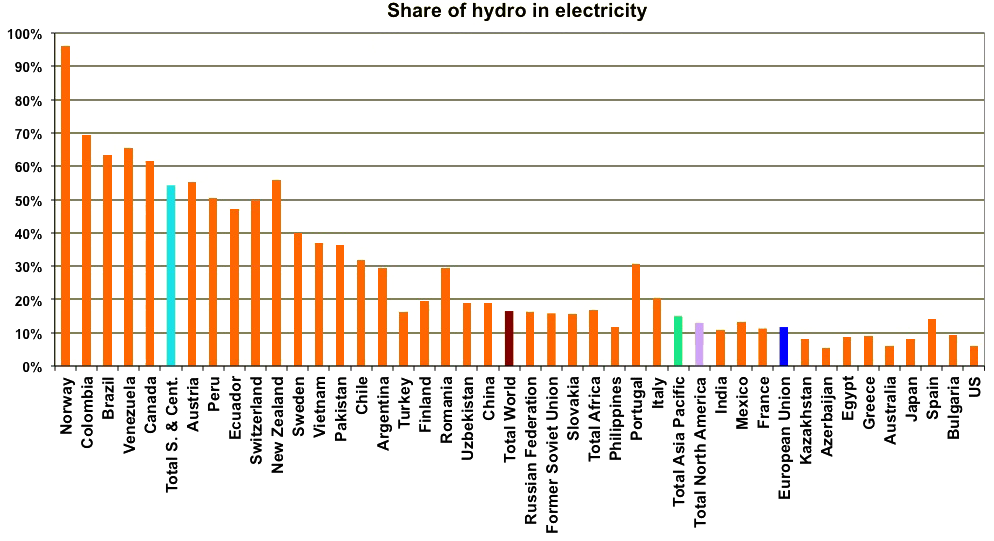
Share of hydro in the total electricity generation in 2014.
As mentionned above, countries with no mountains (Denmark, Netherlands, UK, Belgium…) or little rain (Middle East) do not appear in this graph (the share of hydro is below 0,5%, except for UK which has 2%). On the countrary, the share is high when there are significant precipitations and plenty of mountains (and sometimes a low electricity consumption per capita!). The European average is around 10%.
Source: BP Statistical Review, 2015
If we look at the share of hydro in the energy mix (and not only the electricity mix), we get something close, but not identical.
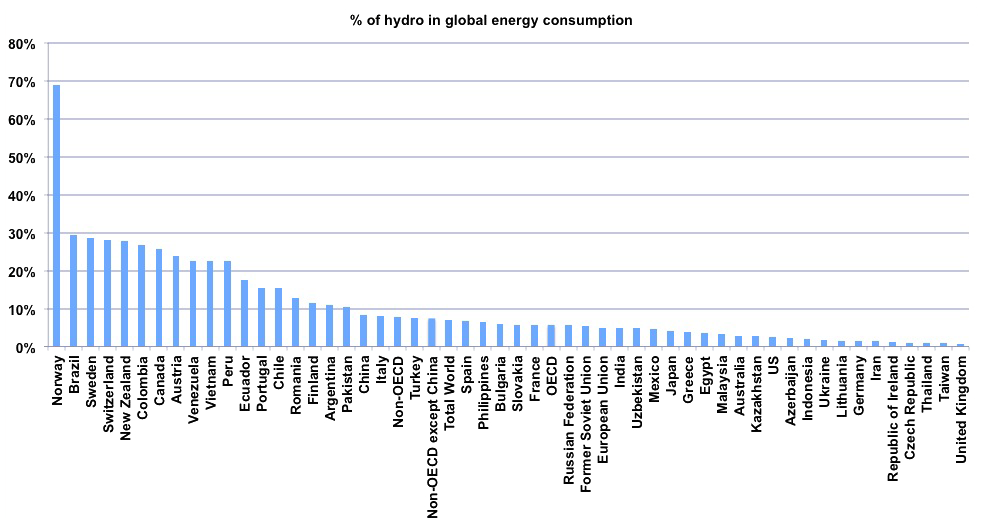
Share of hydro in the total energy consumption in 2014.
The “rich” countries (USA, Europe) are generally below 10%, and it appears even more that the only “rich” countries (which are those that use a lot of energy) that have a high share of hydro in the total energy consumption are those with a high area of mountains per capita (Norway, New Zealand, Switzeland, Sweden, Canada, Austria…)
Author’s calculations on data from BP Statistical Review, 2015
Once we have the global picture, here comes the central question: could we have much more hydroelectricity? Because it looks as a “magic energy”:
- electricity cannot be stored as such, but water can easily be stored in a lake,
- reservoir dams provide the most valuable electricity, fit for all types of demand (baseload and peak),
- it is CO2-free, which is not the case for 2/3 of the world supply,
- electricity is the most polyvalent final energy: it can run an engine, heat, light, cool down, create a magnetic field, transmit information, and in short do about anything.
Why couldn’t we produce all our electricity this way? Actually, not only we are not producing more, but on the opposite dam construction is not on the rise globally.
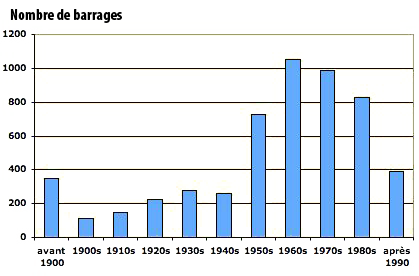
Dams constructed per decade in Europe, 1900 to 2000.
The maximum occurred in the 1960’s.
Source: World Commission on Dams, 2000
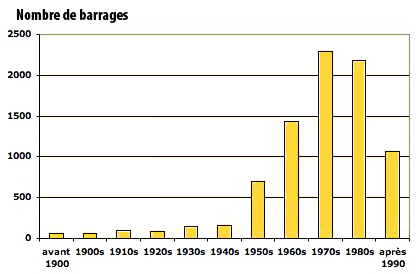
Dams constructed per decade in Asia, 1900 to 2000.
The maximum occurred in the 1970’s.
Source: World Commission on Dams, 2000
Unfortunately, there are limits here as elsewhere. More, there is a theoretical maximum that cannot be crossed. In simple terms, it corresponds to the potential energy of the mass of water that rains on mountains. Suppose that a reservoir collects all the water that fall over 10 km2 of ground, in a region where the annual precipitations amount to 1000 mm (that is one meter) per year.
The volume of all this rain is 10 km² x 1 meter = 10.000.000 m³ of water, weighting 10 million tonnes, or 10 billion kg. If all this water goes into a reservoir, then is forced through a turbine located 1000 meters lower (with a pipe forcing the water down from the reservoir to the power plant where the turbine is), it will release an energy of (E = mgh) roughly 100 000 billion joules, that is 27 GWh.
Now if the height of the waterfall is only 500 meters, we will get half (14 GWh), and on the opposite is the waterfall is 2000 meters high, we will get 54 GWh from this wtaer, after deducting the losses in the turbine.
Now we will performa a small calculation to imagine what maximum contribution hydroelectricity could provide in Europe. The table below assumes that all the rainfall on the various mountains of Europe can be collected to produce electricity with a yield of 80% of the turbine (the rest is lost in friction).
| Mountains | Area (km2) | Annual rainfall (mm) | Average waterfall (m) | Max potential energy (TWh) | Max electricity (TWh) |
|---|---|---|---|---|---|
| French Alps | 44 000 | 1 000 | 1 500 | 180 | 144 |
| Massif Central (France) | 20 000 | 1 200 | 1 000 | 65 | 52 |
| Swiss Alps | 41 000 | 800 | 2 000 | 179 | 143 |
| Pyrénées | 50 000 | 1 000 | 1 000 | 136 | 109 |
| Austrian Alps | 84 000 | 1 000 | 1 500 | 343 | 275 |
| Norway | 100 000 | 500 | 1 000 | 136 | 109 |
| Sweden | 100 000 | 500 | 1 000 | 136 | 109 |
| Italian Alps | 80 000 | 600 | 1 000 | 131 | 105 |
| Rest of Europe | 100 000 | 800 | 1 000 | 218 | 174 |
| TOTAL | 1525 | 1220 |
Approximation of the maximum hydroelectricity contribution in Europe.
We see that the theoretical maximum in Europe would be a little over 1000 TWh per year. But collecting the last rain drop that falls on the mountains is of course impossible. This water must fall on the water catchment of a valley that can be “blocked” with a dam to create a lake.
Indeed, if there is no reservoir up in the mountain, it is impossible to have high pressures, and therefore the production is much lower, with run of river dams that have a much lower output for the same flow. The technical maximum that power companies define as all the electricity that could be obtained with dams everywhere is therefore lower to the theoretical maximum, because it includes only the rain that can contribute to fill an artifical lake, and not what fall on places where it cannot be collected.
In Europe, most people consider that we are close to the maximum feasible. The European hydroelectricity production is close to 500 TWh per year, which a very significant fraction of the theoretical maximum calculated above.
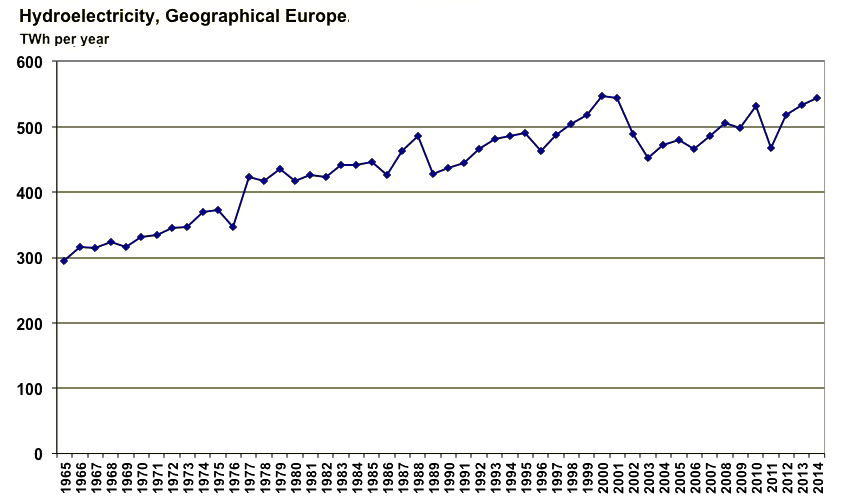
Hydro production in “Geographical Europe” (European Union + Switzerland + Norway) since 1965.
Source: BP statistical Review 2015
Increasing the hydro production from 10% (present value) of the electricity generated to 80% seems clearly impossible, and even a multiplication by 2 might be out of reach. As the other renewable sources are marginal for the time being, and will probably stay as such for a long time, getting most of our electricity from non fossil sources in Europe bears an awful name: nuclear! (actually it might be not as awful as what we think…)
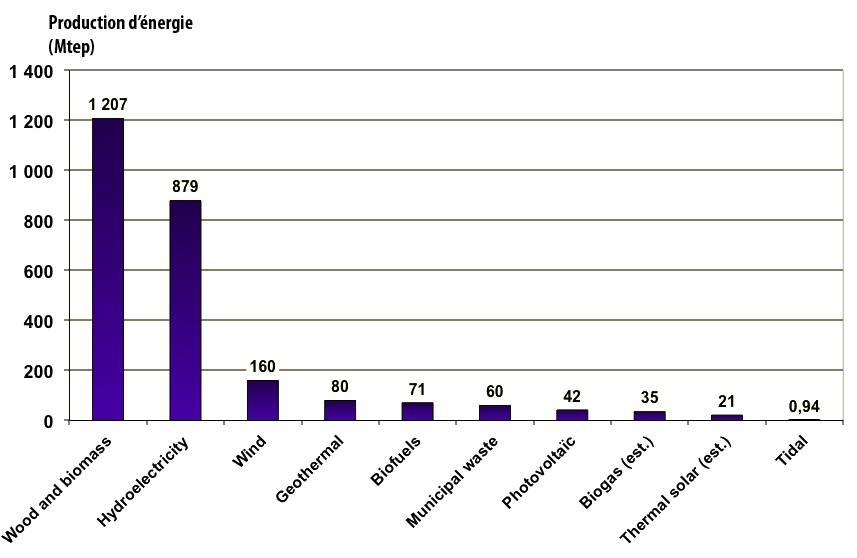
Contribution of renewable sources, wood excepted, to the world energy supply in 2012, in million tonnes oil equivalent.
The preponderance of hydroelectricity is obvious. Electrical energies are converted with the primary equivalent.
Various sources.
And elsewhere?
Europe is not alone. In some other countries, technically feasible dams can represent much more than the installed capacity.
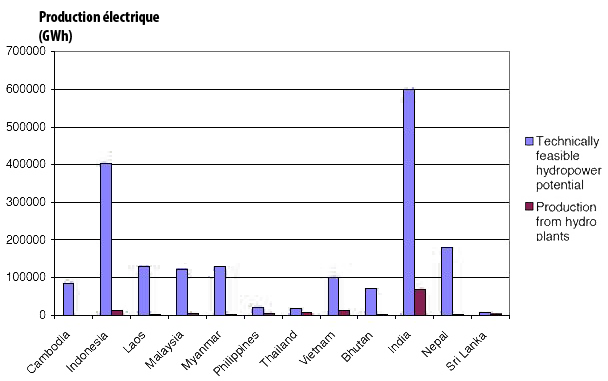
Hydro production in some Asian countries in 1999 (in GWh), and technically feasible potential.
Source: World Commission on Dams, 2000
But it might be that the limits remain far because the electricity consumption per capita is low in the above countries. In France, the hydro production is around 60 billion kWh per year, that is roughly 1 000 kWh par French and per year, and it represents only 12% of our electricity consumption.
On the above graph, we see that India could produce 600 billion kWh of hydropower per year: it’s a lot… but it represents only 500 kWh per capita and per year. If Indians wanted to consume as a French, hydroelectricity alone could not allow it (though there are plenty of mountains). Even Indonesia (250 million people), with 400 billion kWh altogether, could provide 1 500 kWh of hydropower per capita, or 15% of the total electricity if the French standard was the objective.
Hydroelectricity, much better than anything else?
One thing will now be discussed: the fact that hydropower is more friendly for the environment than… nuclear. Provoking thought? Let’s see.
To produce 30 billion kWh per year (or 30 TWh) a nuclear power plant (with 4 reactors) occupies roughly 1 km². To produce several tens of TWh per year, the largest dams in the world (Three Gorges in China, Itaipu in Brazil, Guri in Venezuela, Tucurui in Brazil again) have created artificial lakes over 1000 km² (and some go up to 5000 km²), and in the process all terrestrial life has been flooded. In addition, for the Three Gorges Dam more than 1 million people had to move, that is 10 times the number of peaople that had to be evacuated at Chernobyl or Fukushima.
But nuclear power causes accidents when dams are renewable, therefore harmless! Well, it is not so simple: dams have killed much more people (and animals) than nuclear reactors. In Europe alone, dams have caused more than 2000 casulaties (the two deadliest being Malpasset-Frejus, in 1959 in France, and Vajont-Longarone, in 1963 in Italy).
In the world, the two deadliest accidents have occurred in Banqiao, in 1975 in China (more than 100 000 deaths after a set of dams collapsed because of heavy rainfall), and Machchu II, in 1979 in India, with a death toll over 2000 victims. Even in the US there has been dam accidents, the last significant ones being in 1977 (twice 40 deaths). By comparison, Chernobyl killed several tens of people for sure and the total toll will probably range between hundreds and thousands. But nobody claims phasing out dams!