If we base our judgment on the amount of articles that can be found on wind power in the french press, and the quotation of this source of energy as soon as renewable energies are discussed, it is quite tempting to consider that, for us French, there lies a major potential compared to those of other renewable energies, or compared to our present energy consumption in general.
Now what do the figures say?
What share of wind power in the world energy supply?
If we look at the most widely used renewable energy in the world, it owes nothing to high technology, since it consists in…..wood, that is the first source of energy that our ancestors started to use 500.000 years ago (solid biomass today also comprises wood waste, straw, etc).
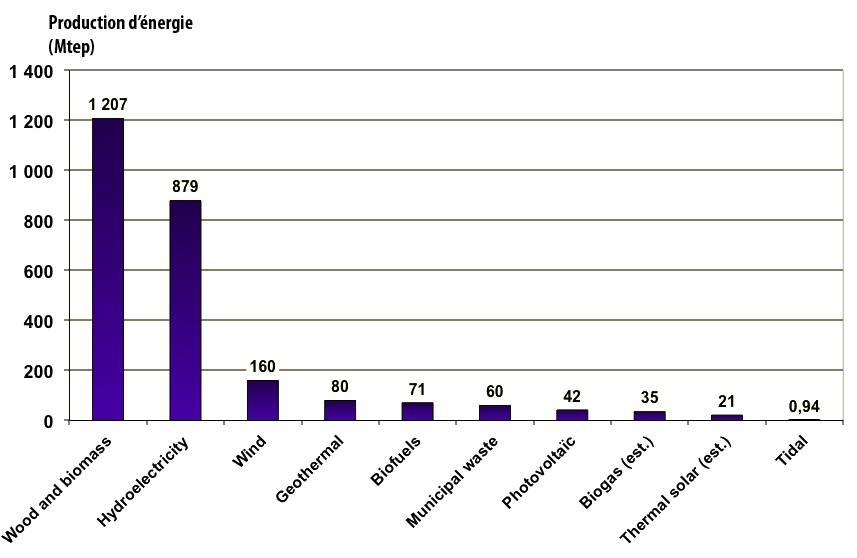
Contribution of the various renewable energies to the world consumption, in million tonnes oil equivalent, in 2014.
(one tonne oil equivalent = 11.600 kWh)
Electrical energies are converted with the primary equivalent.
Source : BP Statistical Review, Energy Information Agency, and various
But an important statement has to be made, still : wood is not necessarily a renewable energy ! Indeed, by definition a renewable energy is an energy which is…renewed. Well, at the present rate of consumption, wood is only partially renewed, and the fraction of the wood that is burnt – and that had to be logged – that is not renewed is called….deforestation.
There is thus a significant – but probably unknown – proportion of the wood consumed which does not fit in the “renewable” category, and which should not appear in the above chart. Still, even the truly renewable fraction of the wood consumed gets the first rank in the overall renewable total.
There are other energy sources that can be found in the “renewable” category whereas the “renewable” aspect can be discussed. For example, it is frequent to find there the energy obtained from the combustion of municipal waste. Producing waste is definitely closely bound to the very existence of life, and as long as there will be men on Earth there will be waste. But part of this waste, today, is composed of plastic (roughly 20%), which is oil transformed into something else. It is probably debatable to consider that this part – which contributes for a large amount to the energy produced by incinerators – is really where it should be when in the “renewable” category !
The same remarks applies to biofuels, which require, to be manufactured, a non negligible amount of fossil fuel, certain lines even having a negative net output (it then requires more than one litre of oil to produce one litre of biofuel). Hopefully all lines are not such, but even in the favourable cases it still requires a fraction of litre of oil – not renewable – to get a litre of biofuel. So, renewable, or not … ?
If, forgetting these nomenclature issues, which are in fact fundamental debates (it is quite frequent to have a debate on notions or objects that have not been previously defined !), we get back to our “ranking” of renewable sources by present contribution, after wood we find hydroelectricity, which is definitely 100% renewable, and which produces amounts that are an order of magnitude over those produced by all the “new renewables” today.
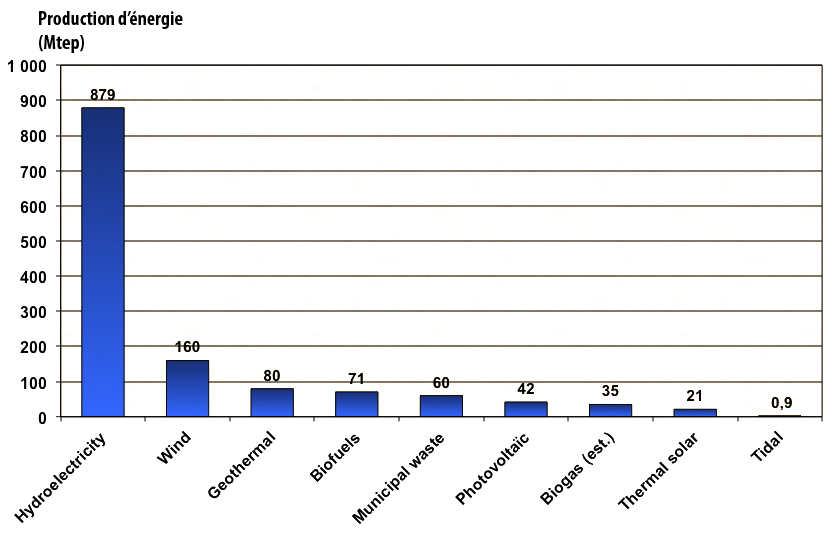
Contribution of renewable sources, wood excepted, to the world energy supply in 2012, in million tonnes oil equivalent.
Electrical energies are converted with the primary equivalent.
The preponderance of hydroelectricity is obvious.
Various sources
The above chart obviously shows that wind power, today, weights less than 1% of the world energy consumption, with the most favourable convention on conversion. One will object, and will be right to do so, that a weak figure today does not necessarily condemn to a weak figure tomorrow. The argument is perfectly sound ; before representing 40% of the world energy consumption, there has been a time when oil represented 0%. Whether wind power can concur to a large fraction of the energy consumption – and allow to save a large amount of greenhouse gases emissions – of an occidental country is discussed in detail for France elsewhere on this site, and I discuss this further below : we’d better investigate also other “solutions” !
The answer might lie within our history books : if we look at the past growth rates for the energies that are now mainstream, we will see that no energy, except for oil at its very begining, grew faster that 10% per year for decades.
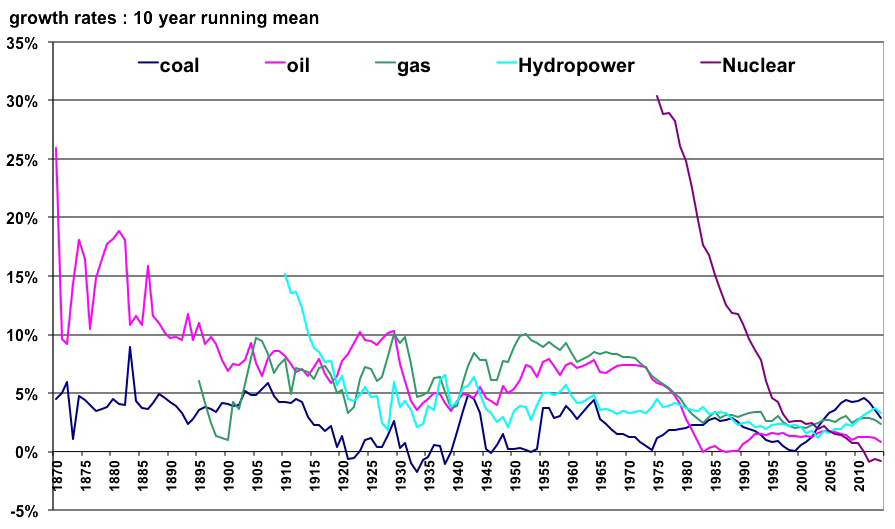
The above curves represent, for each mainstream energy, the 10 year running average of the growth rate since 1860. The value is for the end of the 10 year period, e. g. the value for 1960 represents the average growth rate for the period 1950-1960. The value for 1940 represents the average growth rate for the period 1930-1940, etc.
Except for oil at its early stages (it then represented only several % of the world supply) no major source has kept a growth rate over 10% for 50 years. As soon as an energy becomes “mature”, its annual growth rate fall below 5%, and one should keep in mind that these growth rates occurred in a world where the productivity was increasing, as a result of the increase of the energy available per capita.
It is therefore a bold assumption to make that “uneasy energies” (such as wind, diffuse and intermittent) will be able to sustain higher growth rates than “easy energies” (such as fossil fuels, very cheap to extract and giving very high power on demand), what’s more in a world where the productivity of “physical” work should decrease… precisely because of a lack of “concentrated” energies (it’s this productivity that counts to build grids and power stations, and… windmills).
Source : Schilling et. al and BP Statistical Review for primary data, growth rates from author’s calculations
What share of wind power by country?
The various countries have, as expected, a very different share of wind in the global energy supply.
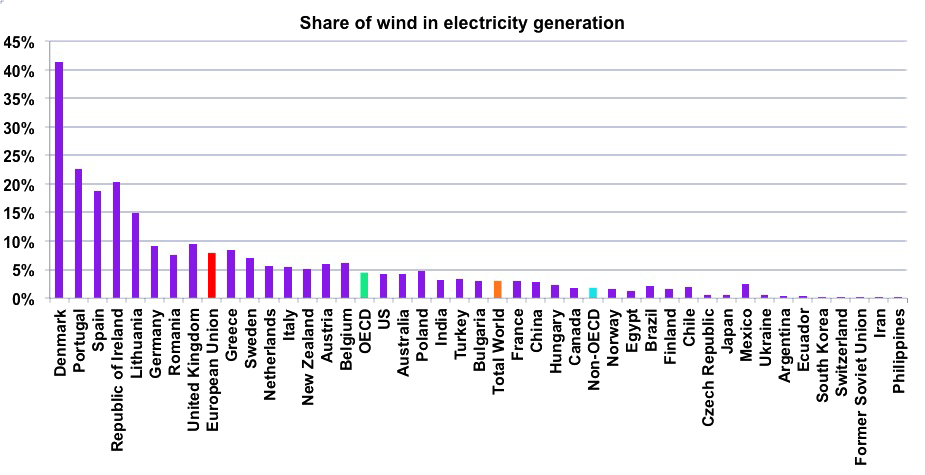
Share of wind in the primary energy supply where this value is greater than 0,2%.
(wind is calculated with the primary equivalent).
France is close to the OECD average, ahead of China (that has the first production in absolute figures) and logically behind the countries that decided to go for it massively.
Data from BP Statistical Review, author’s calculations
But… the countries with a large fraction of wind do not necessarily use it domestically!
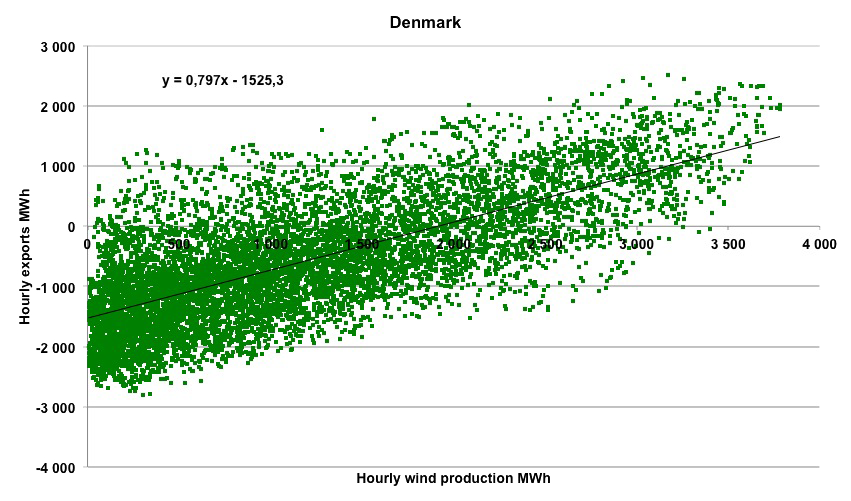
Denmark hourly electricity exports, in MWh, depending on the hourly wind production in Denmark, in MWh, for 2011.
The regression clearly showhs that for 1 extra MWh produced by Danish wind turbines, 0,7 MWh is exported.
In other words, Denmark uses only 30% of its domestic wind production.
Data from pfbach.dk
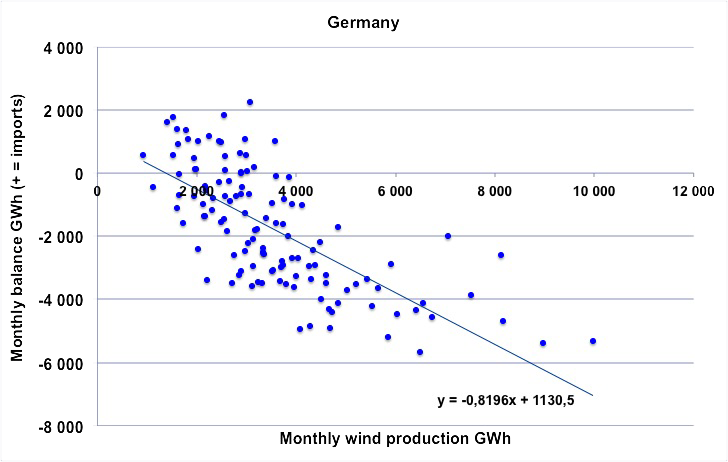
Monthly exchanges (vertical axis, positive values mean net imports and negative ones net exports) depending on the monthly wind production in Germany, from January 2005 to May 2015.
The dots clearly show that when wind production increases, exports also increase. It suggests that increased exports are directely or indirectely linked to an increase in wind production.
Author’s calculations on primary data from ENTSOE
In short, figures do not necessarily match with everyone’s opinion here as elsewhere!