Oil ? Why bother, we still have 40 years of it ! Who never heard this sentence… which is a terrible misunderstanding ? Would it be that we don’t have “40 years of oil” ? Actually we have them, but it doesn’t mean… that we are quiet for 40 years. The explanation of this apparent mystery is below !
We have 40 ans year of oil… and a big misunderstanding
What did the inventors of “40 years of oil” mean ? Something very simple: that, at the date of the statement, the proven reserves of oil were equal to 40 times the production of the previous year. But as we don’t link to think too much sometimes, all those that read or heard this expression made a shortcut that lead them to something a little different.
The steps are the following:
“40 times the production of last year”
=
“we have 40 years if we consume the same amount every year”
=
“we have 40 years of oil”
=
“we are quiet for 40 years”.
It would be true if, overnight, we begun to have a constant consumption, and most of all if we did not care about the 41st year ! A visual translation of this way to interpret this “40 years of oil” is shown below.
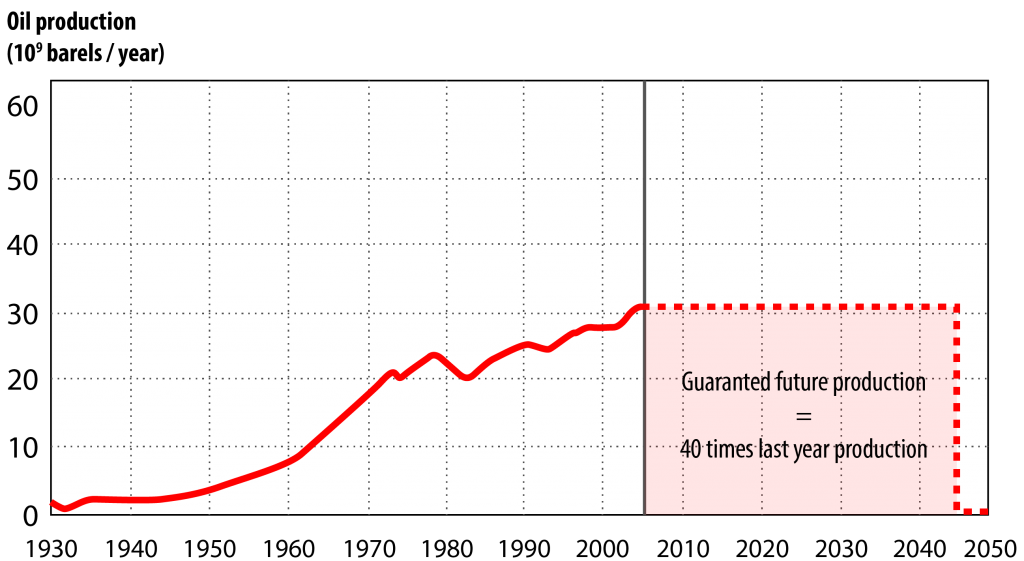
Illustration of “40 years of oil” if consumption remains constant.
It means that the oil we are certain to extract from the ground equals 40 times the production (thus consumption) of last year. Assuming the consumption we desire remains constant, and that production can also remain constant, it does mean that we are quiet for 40 years (though right after, it’s a big catastropha !).
But… no production curve looks like this: a production is not constant for 40 years then zero the 41st one ! And besides our desire is generally to consume more and more, not something constant.
Except that… oil consumption has never been constant since the beginning of oil use. This will lead us to make a first mistake: assimilate “40 years of constant consumption” with “40 years of growing consumption”, since it is only in a situation without constraints (therefore allowing growth) that we can sleep quiet. A visual translation of this most common error (including at the top of democraties, in most papers, in most boards of large companies, etc) is shown below.
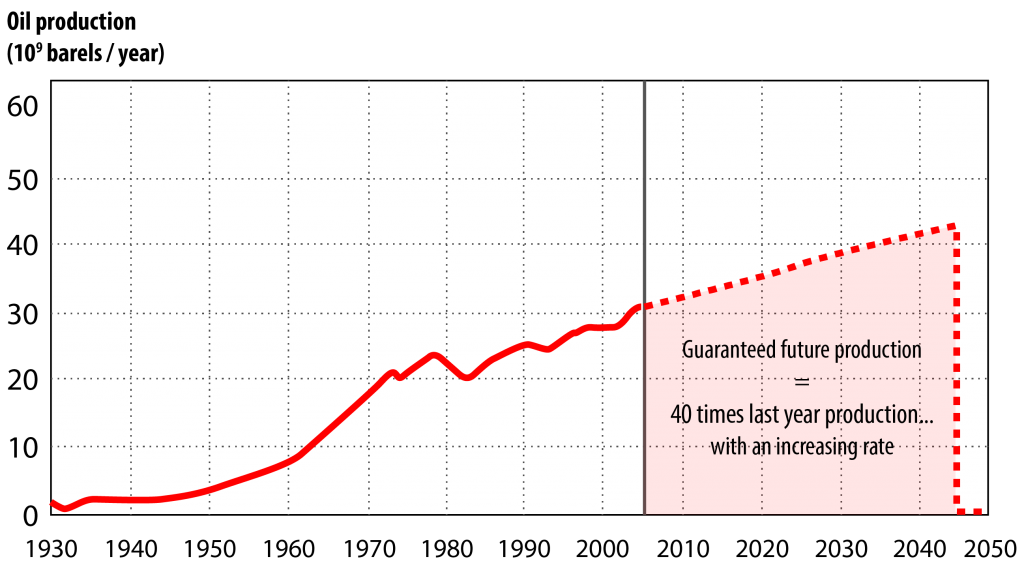
Most common implicit representation of “40 years of oil”.
As consumption has always risen, being quiet for 40 years requires to prolongate that trend for this time length… but then it requires more than 40 times the consumption of last year to sustain this growth !
Again, the world production is not going to rise for 40 years, then get nil the 41st one !
In the two fictious situations mentionned above, we have abundance for 40 years then… nothing. In the second case, we have already assumed that we will extract more oil from the ground than what oil companies published in their proven reserves. But historically it has always been the case, so why bother ?
Actually, be it for a single field or the whole planet, oil production has to look like something close to a bell shaped curve: it begins at zero, rises to a maximum, then declines to zero again (any other shape is forbidden by mathematics !). And given the importance of oil in our economic system, the important moment is when production starts to decline, because then consumption will have to decline (nobody can consume some oil which is not there). The right way to interpret “40 years of oil” is therefore to represent future production with a bell shaped curve, knowing that the cumulated production (to +∞ !) must be at least equal to 40 times the production of last year. This situation is shown below.
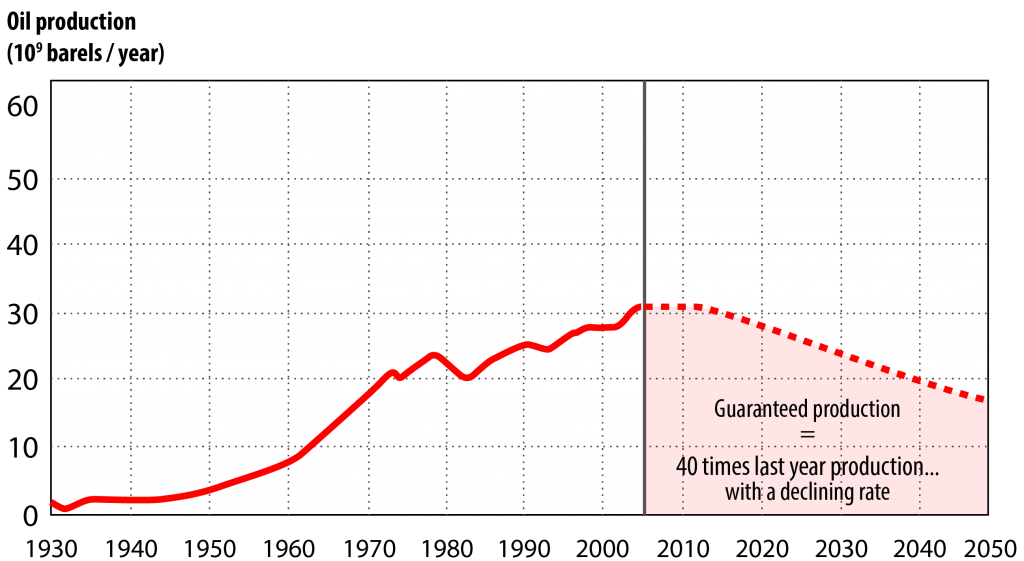
This is the proper way to understand “40 years of oil”.
The future cumulated production we are sure to get (with no time limit) is at least 40 times the production of last year… but this cumulated production will happen with a yearly production going thrtough a maximum then declining.
And then the meaning of “years of tranquility” drastically changes, because the “quiet times” correspond to the number of years before the peak, and it might be much less than 40 years. Then we have indeed “40 years of oil”, but not at all 40 years before trouble ! And it turns out that it is precisely the situation we are in right now: the proven reserves have never been higher, but the peak has never been closer, and we will see below how this apparent paradox is actually not one.
How to have plenty of reserves for tomorrow and the peak right now
It therefore seems that time that passes by puts us closer every day to a peak that is unavoidable. How come this event can be so close when reserves have never stopped growing ? The “solution”, shown below in a couple pictures, is actually very simple, only it takes a little thinking, which is sometimes hard to combine with media shortcuts !
Our little story will begin with the beginning: the general shape of the production of an oilfield, which is also the general shape of the production for the whole planet.
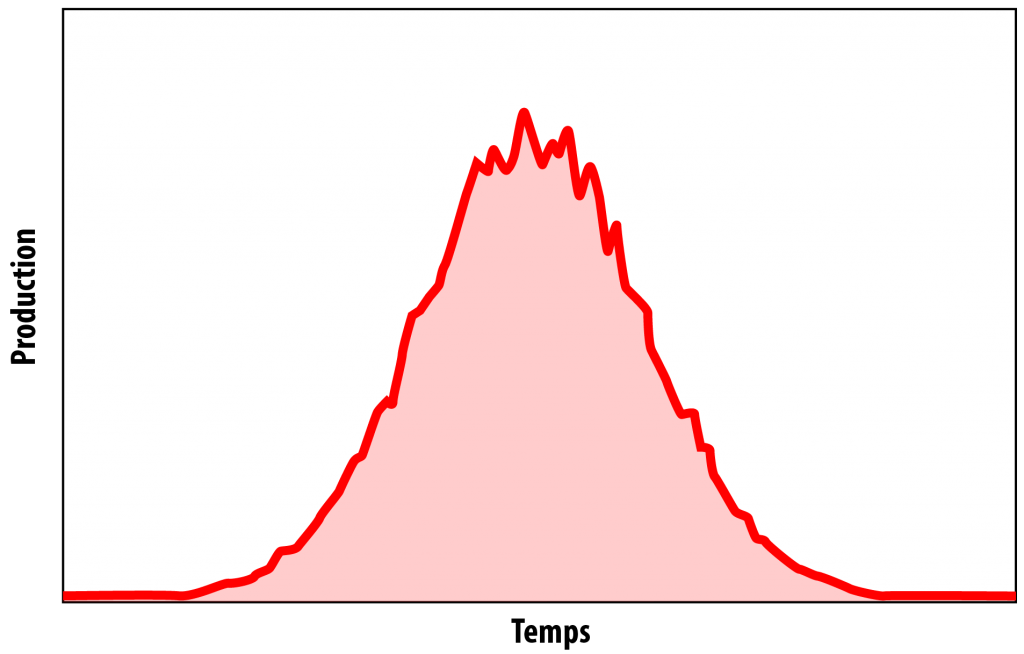
General aspect of a production curve coming from a stock given once and for all, be it an oil field, a full oil province, or the production of any ore or mineral resource coming from a given zone.
The horizontal axis represents time, and the vertical one the level of the production. As we will see below, there might be several “bumps” (in mathematical terms, secondary maximums), but an absolute maximum and a decline to zero at some point are unavoidable.
The overall amount extracted – or cumulated amount – corresponds to the hashed zone below the curve, and it is at most equal to the initial extractible stock. In mathematical terms, this surface is named “integral” of the curve. For oil geologists, this surface corresponds to the ultimate reserves. As it is not possible to extract from the ground something that has not been previously discovered, the value of this integral is at most equal to the cumulated discoveries.
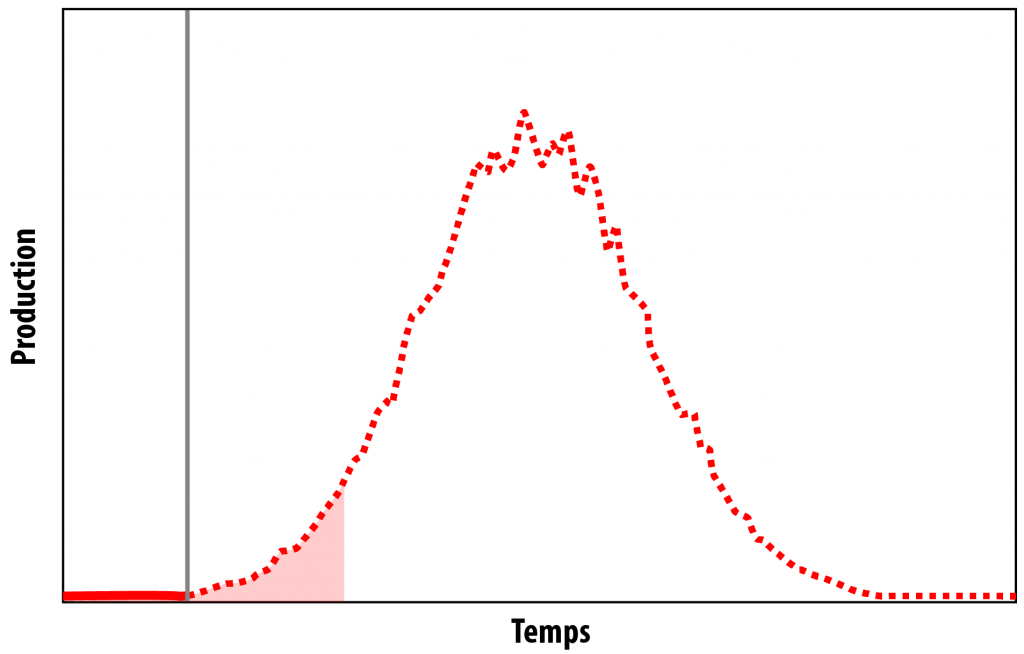
As the general shape of the future production is imposed by mathematics, we will start from there and put on it various times in the past. Let’s assume that we are now in 1900, and that the cumulated production at that time is negligible (to be precise, 230 million tonnes of oil had then been extracted from the ground – mostly US at the time – for the whole 19th century, which is less than 10% of what is extracted every year right now !).
Approximate situation at the beginning of the 20th century.
Oil companies publish figures for proven reserves that correspond to the yellow surface. The rest of the hashed surface corresponds to oil that will be discovered later (in 1900 the main discoveries in the Middle East had not happened) and therefore produced later. As long as it is not in a field in production, this oil cannot be included into the proven reserves. At this point, past production is negligible.
Then the clock turns, and we move to 1950.
Approximate situation in the middle of the 20th century.
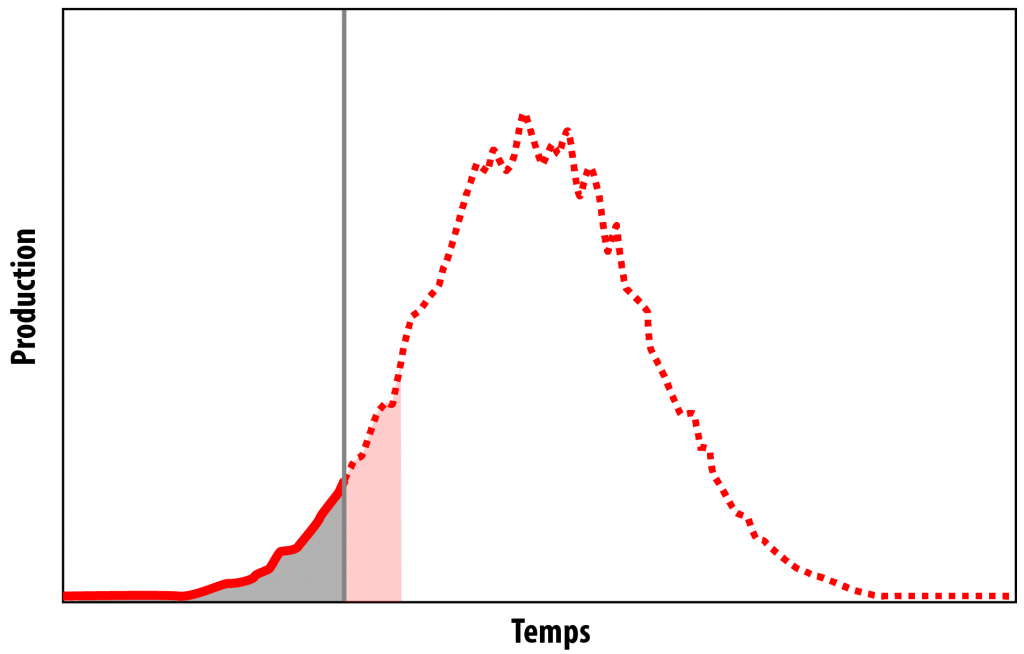
The ultimate reserves (the total amount of oil that will be extracted from the underground from beginning to end) has not changed (by definition). The initial proven reserves have been produced (which is normal since they correspond to a future oil production which is guaranteed) and they are now shaded in blue. In the same time, there has been new fields discovered and put in production, and reevaluations of fields already producing.
These discoveries and reevaluations have added to the proven reserves, and have added more than the extraction that happened during the same time. The proven reserves published are now more important than what was published previously… and in the same time we have gotten nearer to the production peak.
Of course, the proven reserves of that year can be expressed as a multiple of the production of the year of publication.
Then the clock turns again, and we move – fictiously of course – to 1980.
Approximate situation at the “beginning of the end” of the 20th century.
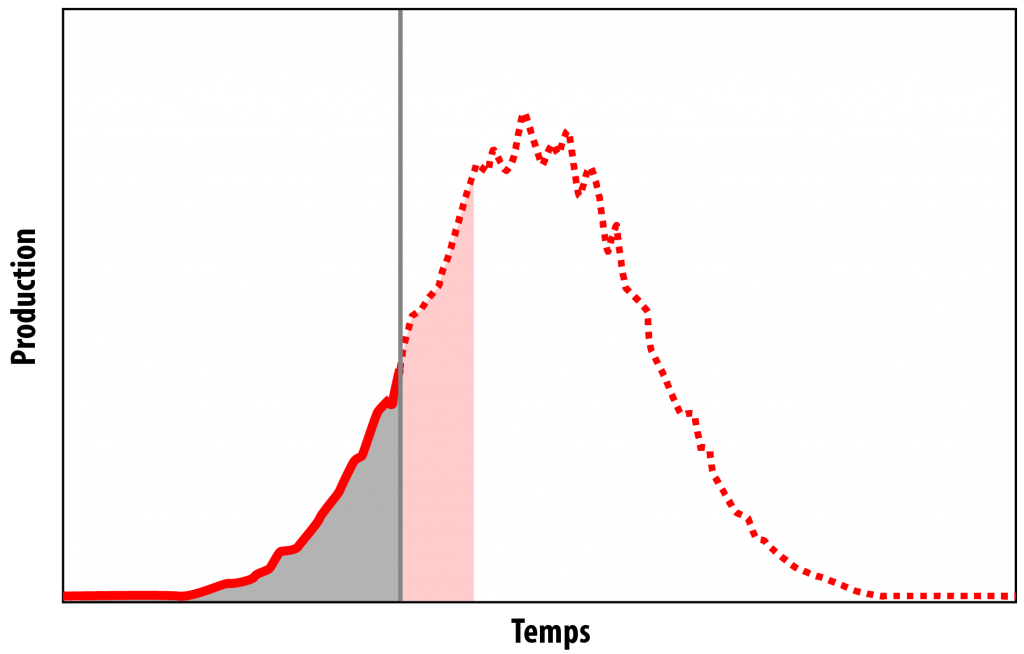
The ultimate reserves (the total amount of oil that will be extracted from the underground from beginning to end) has still not changed. Our knowledge of the ultimate reserves might have changed, but it is not the same !
Again, the proven reserves of 1950 have been produced (they are also shaded in blue), and again, the discoveries and reevaluations have added more to the proven reserves than the extraction that happened during the same time. The proven reserves published at this point – in tonnes – are again more important than what was published previously, and, expressed as a multiple of the production of the previous year, we can have the same number (R/P) than before.
Still, we have again come closer to the production peak !
And then we are… not far from today.
Situation at the beginning of the 21st century.
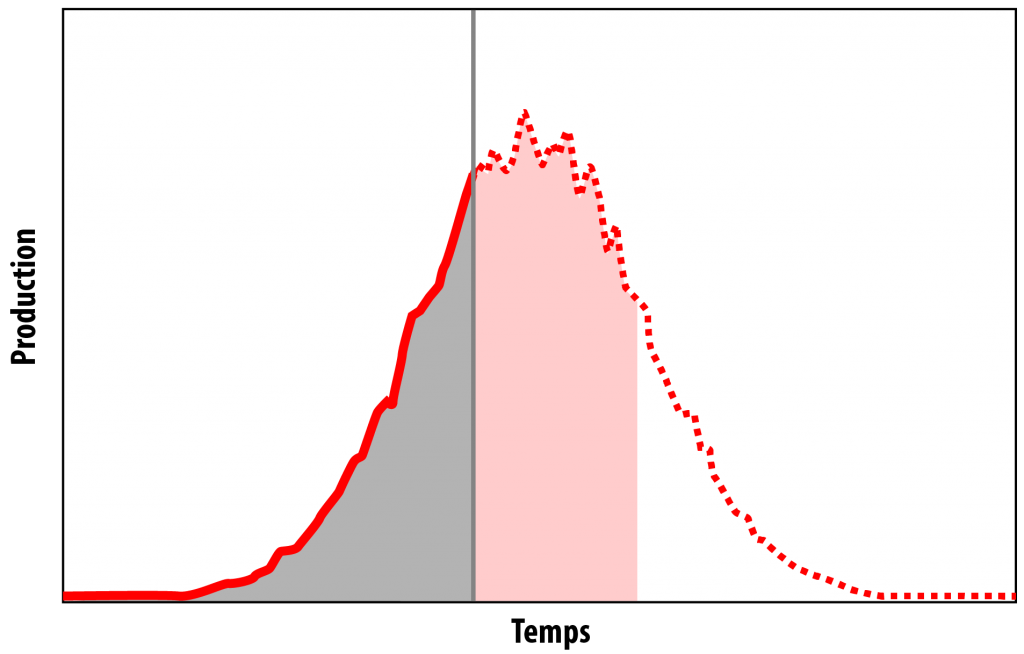
The same processes have produced the same results:
- the ultimate reserves have not changed (let’s recall that these reserves are equal to the sum ot oil already produced, proven reserves, and additional reserves – that is all oil that will be discovered later, or that will come from later reevaluations).
- the proven reserves published in 1980 have been produced and are now also shaded in blue,
- the proven reserves have risen faster than production…
… but we are even closer to the peak, or may be already in it.
In 2012, we have never had so important proven reserves, and though we have never been so close to the peak. Of course, this situation will not last forever: once the peak is behind, proven reserves will decline, and they can even do it… while remaining for a while equal to 40 times the production of last year ! It just requires that the production curve is asymetrical (and it is generally, the rise being faster than the decline).
An important fact is that up to know we have discussed as if the proven reserves reported by various countries are trustworthy. But for a number of countries the figures are more than questionnable, and we cannot rule out some kind of lying poker that blurrs the vision.