In 1970, the oil reserves, published by the oil companies (including compagnies owned by oil producing contries, see below), represented 30 times the production of that year, which amounted then to 2,4 billion tonnes of oil. The published reserves therefore amounted to 72 billion tonnes of oil back then.
In 2010, after having consumed oil for 40 years, for about 125 billion tonnes, that is much more than the reserves published in 1970, there was still roughly 180 billion tonnes of reported reserves (or 1330 billion barrels). Reserves seem to obey to a simple law: the more we draw on them, the more remains !
How can we have witnessed this apparent miracle, which is that reserves have grown and multiplied along with an increasing consumption, when Earth is finite ? The answer to this enigma lies with the definition of the reserves that are reported, that do not represent all the extractible oil that there is on Earth. If such was the case, obviously reserves could only decrease. Actually the reported reserves are proven reserves, and they include only oil that:
- is located in fields currently producing ; fields that have already been discovered but are not in production so far are excluded, and fields that are yet to find (e. g. future discoveries) are even more excluded !
- is extractible with the current state of the art technolgy, and does not assume that new and more efficient techniques come on the market ; these proven reserves therefore exclude future technical progress,
- corresponds to the lower end of the bracket regarding the physical properties of the reservoir rock: its size (or its volume), the porosity of the rock and the quality of the communication between pores (permeability), the oil content of the rock, the viscosity of the oil enclosed, the internal pressure and temperature, and other parameters that condition the amount of extractible oil,
- can be sold at a price that is greater than the extraction cost.
It is obvious that extracting oil from a given field decreases the amount of oil that remains in the said field. Therefore, in order to have proven reserves increasing although oil is extracted from the ground at the same time, it is necessary that “something” happens during the same time interval, and that has the opposite effect. The first idea that comes to mind is generally that new fields are discovered and put in production, thus contributong to an increase in proven reserves. If these discoveries are sufficient, then proven reserves increase faster through discoveries than they decrease through extraction.
But a number of other processes can lead to an increase of proven reserves. Such an increase can come from successive reassessments of the existing fields after they have been discovered and have begun production, and that lead to the conclusion that they enclose more extractible oil than the original estimate done when production began. A proven reserve is indeed not the total amount of oil enclosed in a reservoir, but the estimate of the oil what will go out with an almost absolute certainty, and this estimate is necessarily associated to the date at which it is made.
Before we go any further, it might be useful to recall what is an oil reservoir, for it is not exactely similar to a fuel tank ! Such a “reservoir” designates a porous rock, like lime (or any other sedimentary rock with a minimal porosity ; it can even be sand), burried several hundred or several thousand meters below the surface, and that has various fluids contained within the pores, including the precious oil.
This porous rock is not often shaped in a compact and simple volume, like a sphere. It can have an “ackward” shape, and for example look like the branches of a coral, or the various layers of a sophisticated cake ! When there is such a complex volume, assessing the fraction of oil that might be extracted, that depends among other things on the number of wells that can be drilled here and there, becomes a hard to follow technical debate. Most often, the reservoir rock also contains water, located below the oil, and gas, located above (when all the gas is dissolved into the oil it is called “associated gas” ; when a fraction is free above the oil it is called “non associated gas”). The latter contributes to the internal pressure.
The proportion of oil in the rock (for the part that is impregnated with oil) can go from several % to several tens of %, and this percentage can of course widely vary throughout the reservoir. And at last the viscosity of the oil is anywhere between that of gasoline and that of bitumen.
On top of what has already been explained, a major difference between an oil reservoir and a fuel tank is the flow rate of filling or extraction: it takes millions of years (or more !) to fill an oil reservoir, and to empty it partially men will take several decades to a century. All the elements above explain that, when a new oil field is discovered, assessing precisely how much oil will flow out from beginning to end can lead to a number of debates !
Discoveries, did you mention discoveries ? Indeed, before any oil comes from under the ground, oil compagnies have to go through a little formality : finding where lies this plankton residue. And finding oil generally begins by… an image on a sismograph. The first stage of oil exploration consists in performing specific echograms above sedimentary basins (oil generation can happen only where there has been significant deposits of remains of plankton and little algae, and that corresponds basically to former continental shelves, that also lead to sediment deposit). Explosives are detonated above ground, what send powerfull sound waves towards the underground, and these waves get partially reflected by the various layers and objects when they meet them. Analyzing the echoes allows to know whether there is a significant chance that something liquid lies below the ground (liquids transmit differently sound waves). But at this stage it will not be possible to assess whether there is oil with absolute certainty and in what amounts: if there is liquid within a sedimentary rock, and it is obviously not an aquifer, then then next step will be to decide to drill – or not – an exploration well (call a “new field wildcat” by the oil people) to have an in situ analysis.
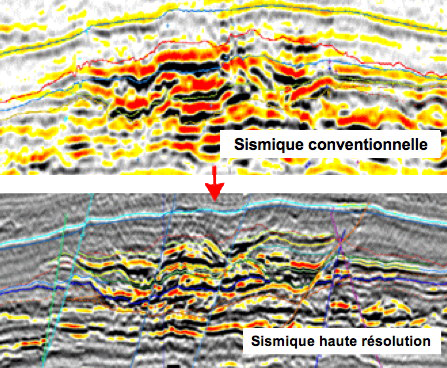
Examples of images obtained through seismic analysis.
It requires a certain skill to be able to turn such an image into a given probability to find oil, and how much!
Seismic analyses are now often performed in 3D, which of course allows to have a better idea of the volumes, but still does not give a definite conclusion on what is below the ground.
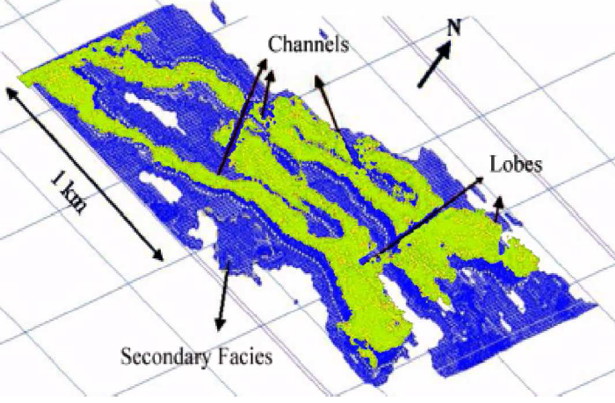
Examples of images obtained through 3D seismic analysis.
This image gives a good idea of the shape of what is possibly a reservoir rock, but it does not tell all the story still: a possible reservoir rock can contain lots of oil or almost none, and an image does not give the pressure, temperature, acidity, etc of what is inside the rock.
On the basis of the seismic analyses performed, the compagny that located “something” can decide to go one step further or not. This “one step beyond” consists in drilling an exploration well. A hole is made throughout the reservoir rock, in order to get a core – a long and thin cylinder of the rock – that is brought to the surface. This core will be analyzed, generally in a remote lab, to see what kind of rock it is exactely, what size are the little holes in the rock called pores, if they communicate easily or not, if there is anything resembling oil in the pores, etc. At the same time various instruments will be sent in the borehole, to measure a whole bunch of parameters (pressure, temperature, conductivity, pH, and more !).
At this stage, 5 times out of six, the exploration well will be a failure: there will be no oil found, or in so little amounts that no commercial production can be considered. But if oil has been found, it is still premature to say how much exactely. The reservoir rock can be very inhomogeneous from end to end, and nobody knows exactely to what extent the core is representative of the whole geological formation, that can be tens or hundreds of kilometers long. Well, in such a case, the answer is simple: drill a hole every hundred meters ! In theory it is an excellent answer, but practically it is generally not compatible with the company’s balance sheet : an exploration well costs at least several millions dollars, and it can be multiplied tenfold if the conditions are uneasy to rough (deep offshore, mountains, artic regions, etc).
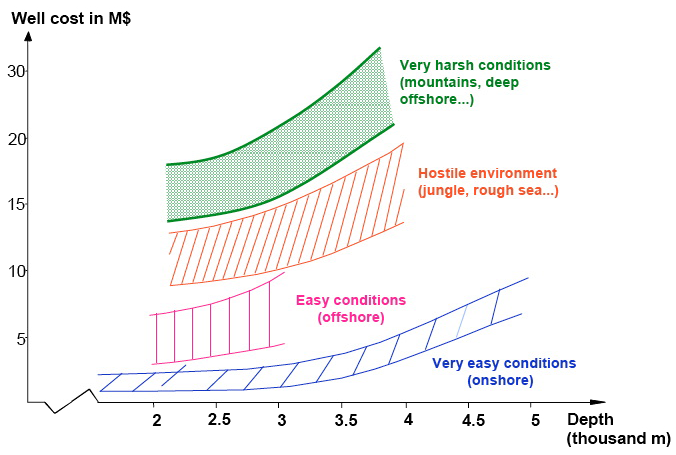
Cost of a “new field wildcat” depending on the depth of the well and the surface conditions.
Source : Pierre-René Bauquis, Total Professeurs Associés, 2008
As a result of the significant price of an exploration well, deciding to go – or not – to the next stage, that is putting what is supposed to be an oil field into production, is done on the basis of a limited number of evidence… and thus a lot of experience !
When there is indeed oil found through the exploration well, then the flow gives a first idea of what might come out. If it is enough to justify to invest more, then the field is put into production. Producing oil means drilling wells to extract as much oil as possible at a cost which remains below market prices. At this moment, and only at this moment, can the expression “proven reserves” be used. For the field put in production, they are evaluated on the basis of the analysis that have been performed during the exploration phase, and the flow rate of the first production well.
For each parameter taken into account (volume of the reservoir rock, porosity, permeability, pressure, viscosity, etc) there is, obviously, an uncertainty range, because values are obtained through sampling or remote techniques, not by strolling inside the reservoir like Jules Verne heroes. The average porosity within the reservoir-rock can therefore be comprised between such and such value, the permeability between such and such value, etc.
All this parameters have a first order influence on either the amount of oil in the reservoir rock (that is called “oil in place”), like the volume of that rock, or on the fraction that can be extracted, like the permeability (which designs the ease with which oil can move from one pore to another). Proven reserves are then obtained by setting all these parameters to the most conservative value of the bracket. It basically corresponds to oil that has a 100% probability of being extracted. But other “reserves” are calculated at the same time, with other values assigned to the same parameters:
- the 2P reserves (proven + probable) correspond to the the most probable value of what will be extracted, from begin to end of production for the field. In mathematical terms (I know it’s almost an insult to use “mathematics” sometimes !), it is the mathematical expectancy of the amount of extractible oil. It will obiously be more than the proven reserves (the proven reserves is the minimum expected), and it is actually the best estimate of what will effectively be extracted from the field (or the most probable value of what will be extracted). This value, generally not published, is what companies base their investment decisions on, because it is statistically the amount of oil they will effectively get. When calculated before oil extraction begins, these reserves are also called the ultimate reserves, because they represent the best estimate of what will ultimately be extracted, from beginning to end, from the field. They are periodically reassessed on the basis of past production, newer techniques, better knowledge of the reservoir rock, etc.
- the 3P reserves (proven + probable + possible) are obtained by setting all the parameters to the best possible value of the bracket ; it is thus the best estimate of the upper limit of what might be extracted in the future. But, for the whole set of oil fields in the world, the probability of extracting what correspond to the 3P reserves is about the same as that of winning at the national lottery !
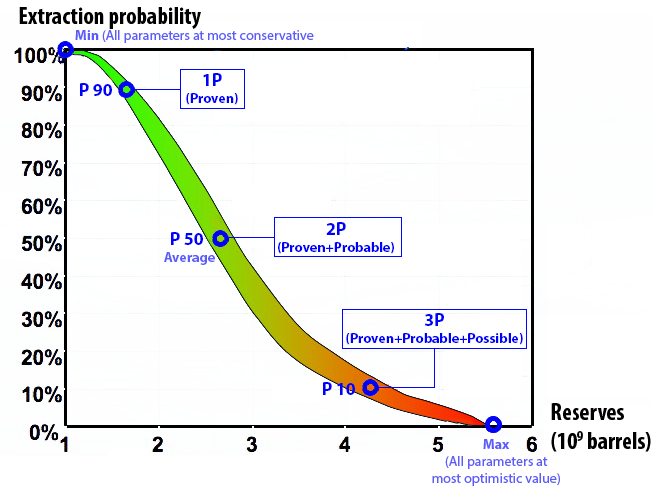
This graph illiustrates, on a fictive case, the values for the various reserves that can be associated to a given field.
By setting all the parameters to the most conservative values, 1 billion barrels will get out ; by setting all these parameters to the most optimistic values, then this figure jumps to 6 billion barrels (not a minor difference !). The set of parameters that correspond to a 10% or more probability of extraction (3P) leads to 4 billion barrels, and the most probable value (2P) is 1,7 billion barrels.
Source : Yves Mathieu, Institut Français du Pétrole, June 2004
Of course, all these values are valid for a given year: none of these reserves include what has already been extracted, except for the ultimate reserves. The proven reserves, which are the only one to be published, therefore do not designate what remains below the surface, and not even what will eventually come out (which corresponds to the 2P), but only the minimum fraction of that oil that the company considers it will extract for sure in the future, with the techniques available today (or in a near future), and in the current economic conditions (in other words the cost of extraction must not be superior to the present market price). A reserve, proven or not, is therefore a subjective notion by nature, and subject to variation over time.
If we now consider not a given field, but a larger zone (a country, or the world !), here is a little diagram giving the three categories that we have discussed above. ci-dessous présente d’une autre manière la différence entre les différentes sortes de réserves.
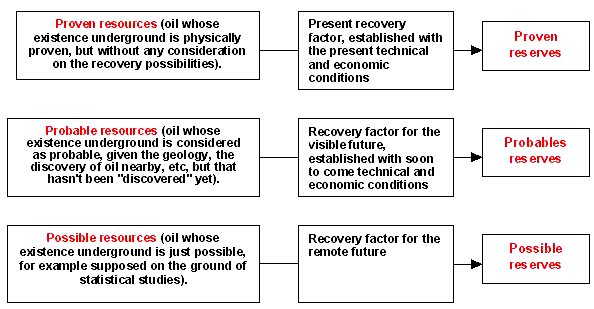
Different sorts of reserves.
Let’s note that the reserves heavily depend of the recovery factors, which designate the ratio between the oil existing in the reservoir at the beginning of production, and the fraction that it will be possible to extract from this reservoir between the beginning and the end of the production (this recovery factor is thus known with certainty only when production is over !).
Now we have understood how reserves are calculated, we have also understood that they necessarily fluctuate over time, because :
- if all the other parameters remain constant, oil production leads to a decrease of reserves (there is no miracle: extracting oil from a reservoir rock decreasing the remaining amont !)
- but there are a number of ways to increase them:
- new oil fields can be discovered and put in production, and that leads to an increase of proven reserves, even with constant technology and prices,
- production techniques can improve, which means that a higher proportion of the oil in place can be extracted, and that also leads to an increase of proven reserves. The extraction ratio (on the oil in place) is presently supposed to be around 35% on average in the world: an increase of 1% – that is going from 35% to 36%, then from 36% to 37%, etc – increases the proven reserves by 3%.
- prices can change: if the price of oil is 20 dollars per barrel, companies will not produce oil at 25 dollars per barrel, even though physically accessible amounts are very significant. If the barrel goes over 60 dollars then any field where the complete extraction cost is 25 dollars per barrel will be included in the calculation of the proven reserves.
- the amount of “oil in place” can be revised upwards, because the volume of the reservoir rock is deemed to be more important than initially evaluated, and more generally a number of reasons can lead to giving a more optimistic value to the lower end of the bracket for the parameters than dimension the oil in place. Such an upward re-assessment leads to an increase of proven reserves (a downward assessment – it happens – would have the opposite effect)
- and at last the reason can be… a mystery ! We will see below that a number of national oil companies (national means that they are owned by states) of the Middle East countries declare constantly increasing proven reserves, with no significant discoveries, no significant improvement of extraction techniques, no significant re-assessment of the physical properties of the fields (that are generally very old, see below). One might then wonder whether we are not witnessing a game of lying poker, where the mobile of the crime is that the share value is proportionnal to proven reserves for companies in the stock market, and production quotas are proportionnal to proven reserves for OPEC national companies (that own 2/3 of the world proven reserves, see below). For the latter, another way to state the facts is that the higher proven reserves are declared by an OPEC country, and the higher share in the global exports of OPEC countries they are entitled to.
All this is indeed hard to follow, even for experts. And then, to add a little more complexity, when something is published, it is not even the same thing in all countries !
- American companies publish proven reserves,
- In the rest of the world, the figures sometimes correspond to the sum of proven reserves, as defined above, 50% of the probable reserves, that include probable future discoveries, and 25% of possible reserves, that also include future discoveries considered as possible.
Now we have a rough idea of what we are talking about (what all people that have an opinion of the future oil production do not necessarily care about !), then we might start to discuss on the evolution of regional or world reserves over a significant period of time (since 1980 to be precise). As a reserve is basically a notion attached to a field, world or regional reserves are built bottom up, by summing up all the reserves for all the fields located in a given zone.
This adds a little difficulty: oil field have no reason to stick to national borders, just to be nice with us when we set up statistics ! Some oil or gas fields cross a border, one of the most spectacular case being the largest gas field in the world, which is located half in Iran and half in Quatar. As extracting gas on either side of the border empties the reservoir almost in the same way, knowing who owns the remaining gas is a good question !
If we suppose that there is a way around this little difficulty, here is how the proven reserves have evolved since 1980: they have doubled for oil, mostly because of OPEC countries, and more than doubled for gas.
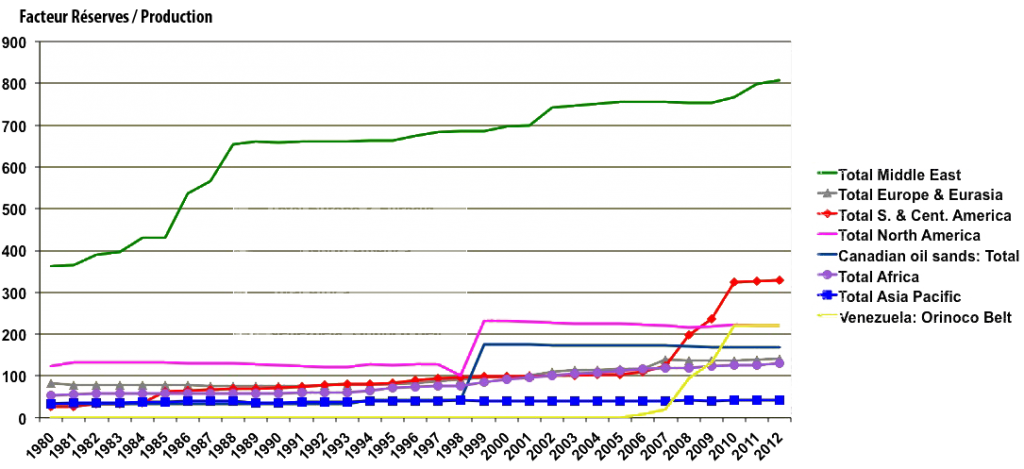
Evolution since 1980 of the proven reserves published for various zones. Canadian Oil Sands (which make most of the reserves for non conventional oil) are reported separately, as well as the extra-heavy of Venezuela (in the Orinoco Belt).
NB: the reserves reported for Southern America include the Orinoco extra-heavy, and the reserves reported for North America include the Canadian oil sands.
It is easy to see that all regions report increasing proven reserves, even though we pump more and more oil from the ground. So is this evolution justified, or it is just a hoax ?
Source : BP Statistical Review, 2013
Now comes the interesting question: what cause (or set of causes) might have justified such a reserve growth ?
Did we discover new oil under the ground ?
The first idea that comes to mind, of course, when one notices that the reserves have increased in spite of an evergrowing consumption, is that many new oilfields have been discovered, and that putting into production these discoveries more than compensate our consumption. Well…. for the last 30 years, this has been totally wrong.
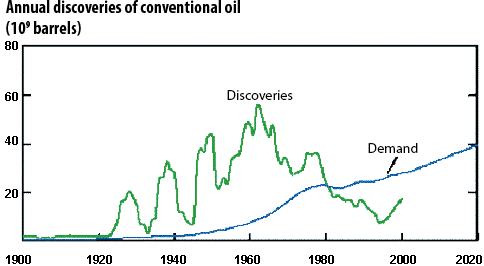
In green, annual discoveries of cenventional oil, in billion barrels, expressed in 2P figures, and in blue, the world annual consumption of oil products (in billion barrels also !).
Since 1980 (some authors even consider this as true since 1970), we consume each year more oil than the extractible fraction of new discoveries.
Source : Exxon Mobil, 2002
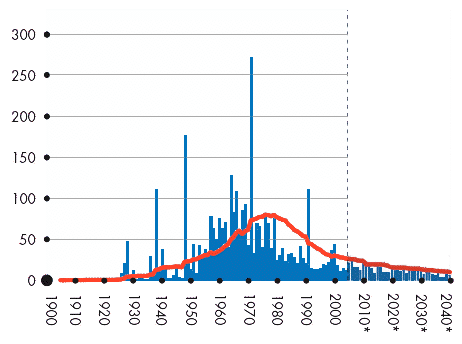
Same curve than on the left, except with annual data, 20 year running mean, and published by another oil company.
his curve gives an information that is not on the left one: discoveries are not expected to rise again after the present decrease.
Source : Shell/IHS Energy, 2005
In particular, almost no “giant oilfield”, that is those who “make a difference” for the world total of the resources, has been discovered since 1980.
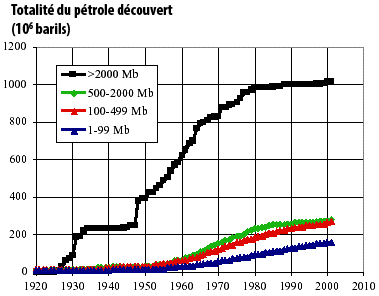
Breakdown of the cumulated discoveries (2P values), for the whole world except US and Canada, in billion barrels, depending on the class of size and the year (Mb means million barrels ; 1 barrel = 159 litres).
We will note that discoveries still happen for “small” oilfields (blue and red curves go on rising, but almost no “giant oilfield”, over 2 billion barrels apiece, has been discovered since 1980, and almost no “large oilfield”, between 500 million and 2 billion barrels apiece, has been discovered since 1990.
Besides small oilfields are less easy to exploit than large ones.
Source : Jean Laherrère, 2003
To illustrate the fact that the “major” discoveries” are now pretty ancient, one can observe that most oil production for the Middle East – which totals 2/3 of the world reserves, and a third of the world production – comes from oilfields discovered a very long time ago.
Saudi Arabia
70% of the production of this country comes from oilfields discovered more than 50 years ago
| Name of the field | Age discovery in 2002 | Production (thousands barrels daily) | % of the country's production |
|---|---|---|---|
| Ghawar | 54 years old | 4.500 | 56% |
| Abqaiq | 62 years old | 600 | 7,5% |
| Safaniyah | 51 years old | 500 | 7,5% |
Iran
50% of the production of this country comes from oilfields discovered more than 40 years ago
| Name of the field | Age of discovery in 2002 | Production (thousands barrels daily) | % of the country's production |
|---|---|---|---|
| Gachsaran | 65 years old | 500 | 15% |
| Marun | 39 years old | 500 | 15% |
| Karang + Doroud + Bibi Hakimeh | 41 years old | 520 | 16% |
| Aghadari | 66 years old | 200 | 6% |
Irak
80% of the production of this country comes from oilfields discovered more than 44 years ago
| Name of the field | Age of discovery in 2002 | Production (thousands barrels daily) | % of the country's production |
|---|---|---|---|
| Kirkuk | 75 years old | 900 | 32% |
| Rumaila South | 49 years old | 500 | 18% |
| Rumaila North | 44 years old | 700 | 25% |
| Al-Zubair | 64 years old | 150 | 5% |
Kuweit
67% of the production of this country comes from oilfields discovered more than 47 years ago
| Name of the field | Age of discovery in 2002 | Production (thousands barrels daily) | % of the country's production |
|---|---|---|---|
| Burgan | 64 years old | 1.200 | 57% |
| Raudhatain | 47 years old | 200 | 10% |
Age of some of the major oilfields in the Middle East.
The 3 more important (Ghawar, Kirkuk, Burgan) yield together 40% of the production of the 4 above countries in 2002, and have been discovered just before or just after the Second World War. No significant oilfield for the production of these countries has been discovered during the past 35 years.
Source : Matthew Simmons, Simmons & Cie
If the world annual discoveries, expressed in 2P figures (that is the best estimate of all the oil that will come out from the discovered fields) are inferior to the world annual consumption, it meens that the growth of proven reserves must come from “something else” than discoveries. In short, proven reserves did not increase mainly because of new discoveries.
We then have to evaluate the evolution of economic conditions, technolgy, and…the rest. Actually technology and economy are a little linked together : if technolgy becomes more performing, the extraction price diminishes a little “everything remaining the same otherwise”.
Did the technical conditions change ?
At the beginning of the oil production era, all we could do was to drill a vertical well into the oil reservoir, then wait for the oil to kindly spring up to the ground under the pressure of the gas generally present in the same reservoir. Of course, as soon as the gas pressure becomes too low, nothing comes out any more. Hence proceeding by “stupidly” sticking a vertical tube in the ground, like it was done at the beginning of the oil era, does not frequently allow to recover properly the oil in all the parts of the reservoir. Since that time the drilling and extracting techniques have considerably improved: it is now possible to drill “sideways”, horizontally, with several branches…(a couple of examples below).
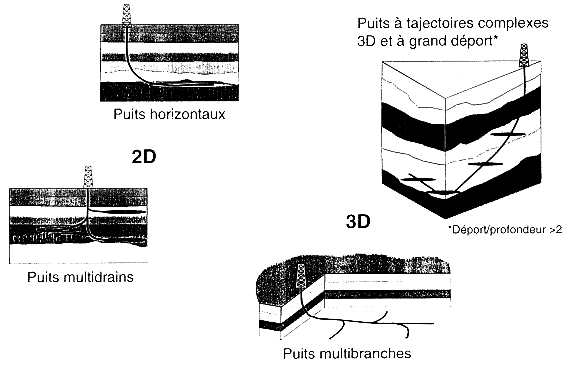
A couple of examples of sophisiticated wells now of common use: horizontal well (top left), sideways drilling (top right), multiple branches (bottom left and right).
Source : IFP
It is also possible to inject water, vapour, or pressurized gas, in the reservoir to extract a larger fraction of the initial oil. The “recovery factor” (which is truly known only when the oilfield is abandonned) can vastly vary from one oilfield to another, with a median value located around 35% (graph below).
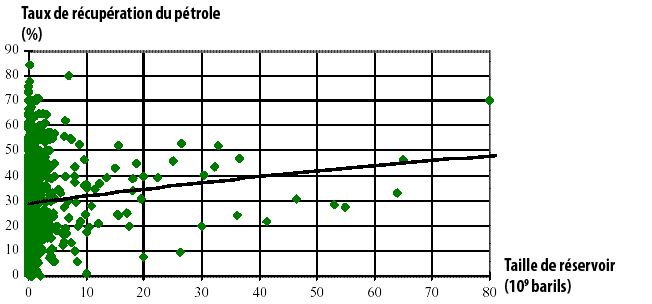
Recovery factor observed or supposed (vertical axis) for 3300 oilfields in the word, depending on the size of the reservoir (that is the amount of oil physically underground) expressed in billion barrels (horizontal axis).
1 barrel = 159 litres.
Source : Jean Laherrère, Petroconsultants, 1997
Even without discovering new oilfields, an increase of this recovery factor for the existing resources increases mechanically the proven reserves, and oil companies willingly explain that this recovery factor went from 25% to 35% during the last 30 years, what generates, even with no new oilfield discoveries, an increase of almost 50% of the proven reserves (before production). There is of course a limit to the possible reevaluation that comes from the technical progress, because recovery factors do not only depend on the methods used, but also – and mainly, say the geologists – on the physical characteristics of the reservoirs (size and permeability of the pores, mainly) and of the oil (viscosity for example).
The factor presently observed is only 3% for some reservoirs said to be “compact fracturated”, where the oil circulates with great difficulties, and technical progress won’t enable to increase this figure a lot, but can jump to 80% when the rock that contains the oil is very porous, and the oil itself pretty fluid, as in Lybia or Canada.
Besides some studies suggest that technical improvements do not allow to significantly increase the recoverable fraction of a reservoir, but mainly to extract it faster. As estimates of the resources – and therefore of the reserves – are sometimes based on the flow coming out of the wells already drilled (and the estimates of what lies underground increase with this flow, of course), one understands better that this little discussion is not without importance !
Have the economical conditions changed ?
Another reason sometimes put forward to the “growth” of the resserves is the fact that the price of the barrel has significantly increased since 2000, making worthy the extraction of resources that were too costy before (deep water for example).
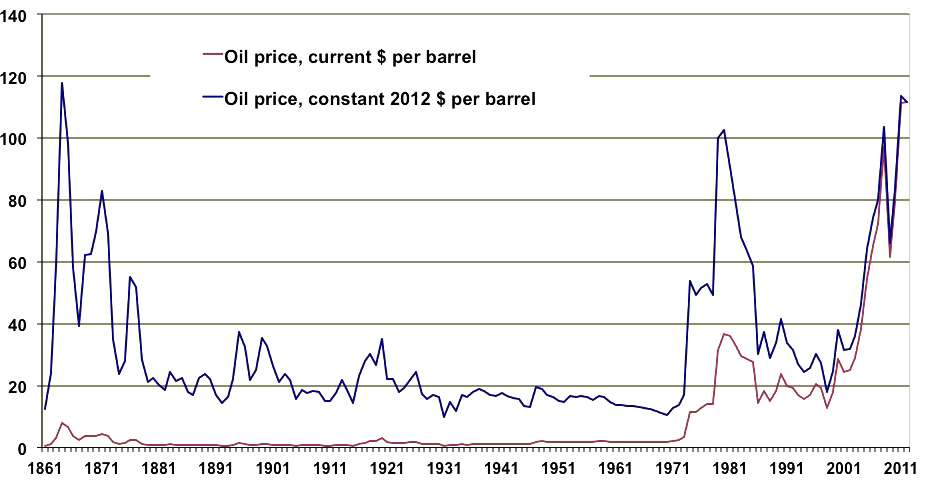
Price per barrel in dollars of the day (red) and constant 2012 dollars (blue) since 1860.
Source : BP Statistical Review, 2013
However, a first remark is that proven reserves have also increased while the price of the barrel was decreasing, so this explanation cannot account for most of the increase ! Even when the trend is a rising price, the observation of historical trends show that the doubling of the price of the barrel increased the reserves by a couple % only for conventional oil. In other words, the extractible fraction of oil in already producing fields (because proven reserves are limited to producing fields, with minor exceptions) does not depend much on the price of the barrel.
Economists use to say that the amount of reserves has a very low elasticity to the price of the barrel, contrary to what can be witnessed for other mineral resources, like ores. There is a very good reason to this: for metal ores, when the metal price rises, it becomes possible to exploit ores that have lower grades, even if it requires additional energy spending, and therefore reserves increase (it is notably the case for uranium). There is of course a limit, but as the product extracted is not among the inputs required to allow the extraction (operators do not use energy to get energy), the limit will be economical before being physical: the price of the inputs – partially driven by their scarcity, of course – must remain below the price of the output, and there will always remain something under the ground (it might be very small, though !) when extraction stops because it is not profitable any more.
For liquid or gaseous hydrocarbons, and more generally any energy resource, there is also a purely physical limit (that can be reached or not before the economical limit is reached): as energy is used to extract… energy, the physical limit is reached as soon as it requires more than 1 kWh (or toe or MBTU or whatever) to extract and refine 1 kWh (or toe or MBTU or whatever) of oil (or gas or coal).
This physical limit drives the fraction of the oil that will be ultimately extracted from a conventional oil reservoir (extraction becomes physically harder when the residual amount of oil decreases): when it is necessary to spend more energy than what is enclosed in the amount extracted, there is no “primary energy reserve” any more.
Primary energy and final energy
Mother Nature does not grant us, ready to use, all the energy types that we use for our daily life: no natural process allows electricity to “come out from the wall” just like that, there is no natural fountain of gasoline or butane available anywhere, and among living species only plants know how to use directely solar energy to produce something else than heat. The forms of energy that we use, and that are labelled “final energies”, are obtained from available energy resources in the world, that are labelled “primary energies”.
The latter include crude fossil fuels (raw coal, crude oil, gas), biomass, fissile or fertile nucleus (mostly uranium 235 and 238, and thorium 232), nucleus that can fuse or produce fusible nucleus (deuterium and lithium), the kinetic energy of elements (air through wind, water through falls or tides, etc), electromagnetic radiation, and natural radioactivity of the planet (that generates the internal heat of the Earth, thus geothermal sources).
From these primary energy sources, we will obtain, directely or through various treatments, like refining oil or operating a coal-fired power plant, final energies (electricity, gasoline or jet fuel, heat in an oven, etc). Electricity, just as hydrogen, are final energies, non-existant in the natural world, and obtained from a primary energy source. It is important to note that a primary energy source, to contribute to our supply, must necessarily provide more energy than what is used to access it.
For any given country, the primary energy supply is always greater than the final energy supply ; the difference between the two being internal uses and losses of the energy industries. For example, in a thermal power plant, heat is produced from burning fuels, or from splitting uranium nucleuses in two, and this heat will be partially converted into electricity, the remainder being either evacuated into the environment (standard case), or partially valorized as exploitable heat (co-generation).
In such a case, the primary energy value corresponds to the heat produced, and the final energy value corresponds to what comes out under an exploitable form: electricity alone in most cases (the final energy content is then 25% to 55% of the primary energy content), or electricity plus valorized heat (heat for industries, urban heating…) in the case of cogeneration (the final energy content is then 60% to 80% of the primary energy content).
For any energy “balance sheet”, the difference between primary energy and final energy thus includes:
- heat lost in the environment for power plants (this heat loss is not restricted to nuclear power plants !)
- energy used to refine, extract and distribute hydrocarbons,
- heat losses due to electricity transport and distribution
- energy used to liquefy natural gas before its transportation in a ship,
- more generally anything that happens between the “natural” source and what is used by the end-user, individual or not.
What is explained above the bow is that when it becomes necessay to spend more than 1 unit of energy to extract 1 unit of energy from the ground, there definitely remains a resource in the ground, but not a primary energy source any more. To exploit it, it becomes then necessary to have another primary energy source, that will use more energy than the content of what is extracted, for example a nuclear or solar power plant that will inject steam or pressurized water to “wash” an oilfield and bring to the surface an additional fraction of the oil it contains (this “enhanced oil recovery” process is already in use for a significant fraction of the Saudi Arabian oilfields, but for the time being the energy spending for the extraction is still minor compared to the energetic value of the oil extracted). When such an “enhanced oil recovery” process uses more energy than what is enclosed in the oil extracted, the oilfield remains a resource, but does not contribute to the primary energy supply any more.
If an increase of the price of the barrel has a marginal effect on the short term increase of the volume of the reserves, such a price increase sustained for a long period of time will nevertheless turn profitable the extraction of resources other than conventional oil (extra-heavy oil, part of the shale oil, etc), than can be used to supply the same final energy products than conventional oil, but have higher operational – and energy – costs. Part of these resources wil never be “energetically profitable” (it is notably the case for most of the shales) but for others it is just a matter of price.
One should note that for coal, the “energy” limit is almost never reached, because the energy used for extraction is mostly mechanical, and the mechanical energy required to extract a fuel which is solid and already “concentrated” does not represent much of the calorific value of the fuel extracted.
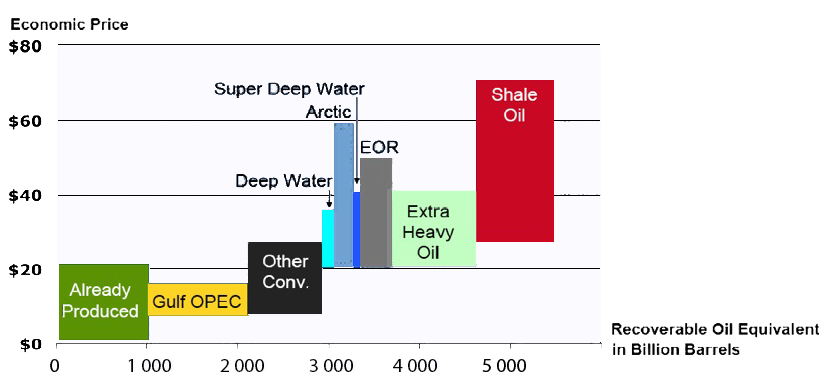
Production costs of various hydrocarbons depending on the type.
Oil that has already been extracted has cost between 2 and 20 $ per barrel, Gulf OPEC (that is Middle East countries) can produce their remaining crude between 6 and 15 $ per barrel, the other conventional oil producers can operate at costs below 26 $ per barrel, etc.
These production costs are given with no “cost of CO2” (that is an economic way to penalize greenhouse gas emissions that occur during extraction and refining), that could severely limitate – it would even be the name of the game ! – the economic interest of extracting part of the existing resources.
NB1: EOR means “Enhanced Oil Recovery”: it designates various processes (injection of steam, water, or various polymers, for example) that allow to recover a higher fraction of the oil in place in the reservoirs, but ask for more investments and thus cost more per barrel extracted.
NB2: this graph means that Chevron considers that the energetic content of the remaining extractible liquid hydrocarbons is 4000 billion barrels (without taking into account the energy required for the extraction, transformation in the case of shale oils, and refining) that is 550 billion tonnes, which is far more than what is deemed to be extractible by most sources.
Source : IEA/Chevron
The conclusion of all this is that a price increase maintained over a significant period of time will lead to an increase of the reserves, but it requires the time to put non conventional oilfields into production (let’s recall that a reserve necessarily corresponds to an oilfield currently operated) and the “response” to a price increase can thus take from 5 to 20 years. In addition, increasing reserves is one thing, but increasing the production (that is the flow rate) is something very different !
If oil is in finite quantities, what has decreased while reserves increased ?
As we have seen at the top of this page, a proven reserve is a simple declaration of the operator, and corresponds to the oil that the company guarantees to extract from the fields it operates, given the geological, technical and economical data available. It is thus a sub-category of the remaining oil in the ground, and, as all the oil in the ground cannot increase over historical time scales, if the proven reserves increase it is that another category of remaining oil is decreasing somewhere.
To understand clearly what is going on, we must go back to the ultimate reserves. As stated above, for a given field or zone, these reserves correspond to the best estimate of all the extractible oil that this field or zone can give, from beginning to end of production. Be it for a field, a region, or the whole planet, the ultimate reserves correspond to the sum of:
- all the oil that has already been produced, because that oil is obviously extractible !
- what is enclosed in the proven reserves,
- what is enclosed in the probable and possible reserves, and that includes:
- future upward reevaluations of the extractible oil remaining in fields already in production, either because the characteristics of the reservoir are considered to be more favorable than previously, or because technical possibilities will improve, or because the price will be higher,
- the extractible fraction of oil located in fields that have already been discovered but not put in production yet (oil “yet to be developped”),
- the extractible fraction of oil located in fields that will be discovered in the future (oil “yet to be found”).
By definition, world ultimate reserves are constant (for those that love maths, world ultimate reserves are nothing else than the integral of world oil production from beginning to end, and the resulting value is independant of any date. But the estimate of that value can change with time, generally towards a more reliable figure, because with time a higher and higher fraction of these ultimate reserves is composed of past production).Well during the past decades:
- What has already been consumed has increased (most obvious, my dear Watson !)
- what is enclosed in the proven reserves has increased, as we have seen,
There are thus only two possible outcomes with this information (sorry, it’s maths !):
- either the estimate of the ultimate reserves has also increased, which allows to have at the same time an increase in proven reserves and an increase in oil already consumed,
- or the estimate on the ultimate reserves remains the same, and then it means that probable and possible reserves have decreased, making room for the growth of past extraction and proven reserves. In this cas, there is not much to expect from future discoveries, future reevaluations, etc.
It happens that ultimate reserves have long been the subject of regular estimates, and the median value of these estimates, for the last 30 years, has been…stable.
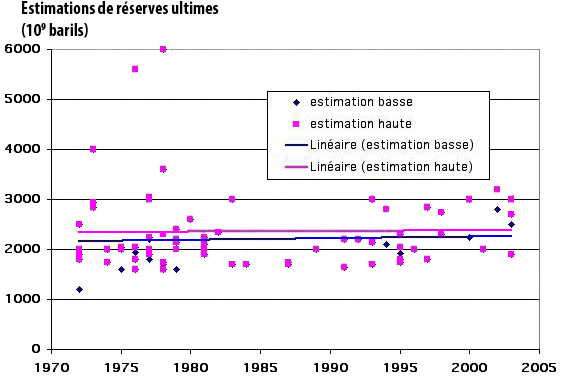
Published estimates on the ultimate reserves, from 1970 onwards, in billion barels (reminder: 1 metric tonne = roughly 7,3 barrels).
There is no clear tendancy to an increase – or a decrease – of the ultimate reserves, that have been around 2500 billion barrels for the last 30 years if we take the median value of these estimates (and the most optimistic evaluations have been made just after 1975 and not in 2000 !).
We also note a narrowing with time of the difference between “optimistic” and “pessimistic” estimates.
Source: Compilation done for the May 2003 ASPO seminar in Paris
The logical conclusion comes: if the proven reserves have increased during the last decades, along with past consumption, it is just because probable and possible reserves have decreased accordingly.
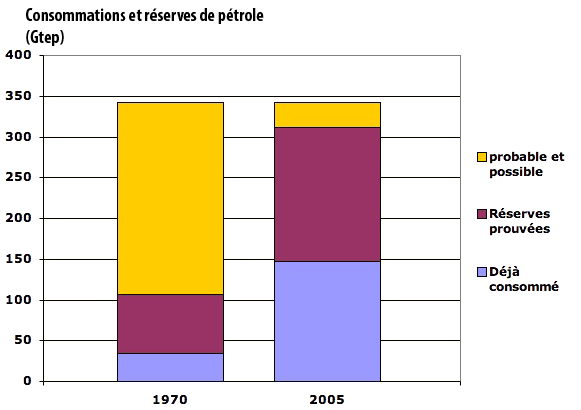
Comparison of cumulated consumptions, proven reserves, and speculative (probable + possible) reserves in 1970 and 2005, supposing ultimates reserves stable at 2500 billion barrels, that is 340 billion tonnes oil equivalent (1 tonne = 7,3 barrels on average).
What we have done since the warning of the Club of Rome is not to have enlarged the world, just changed the classification that applies to oil for which we already knew, on statiscal basis, that it would be discovered and extracted one day.
Sources: Schilling & Al. 1977 and IEA (cumulated consumption), BP Statistical review (proven reserves), and ASPO and IFP quoted above for the utlimate reserves.
On the basis of what oil geologists disclose on ultimate reserves, the prospective for 2040 is not very different now than what it was in 1975.
Where are the reserves ?
The answer to that simple question is also very simple: reserves are where consumers are not. The Middle East countries, that use “only” 6% of the world oil, own roughly 60% of the proven reserves, which now represent most of what remains to be extracted.
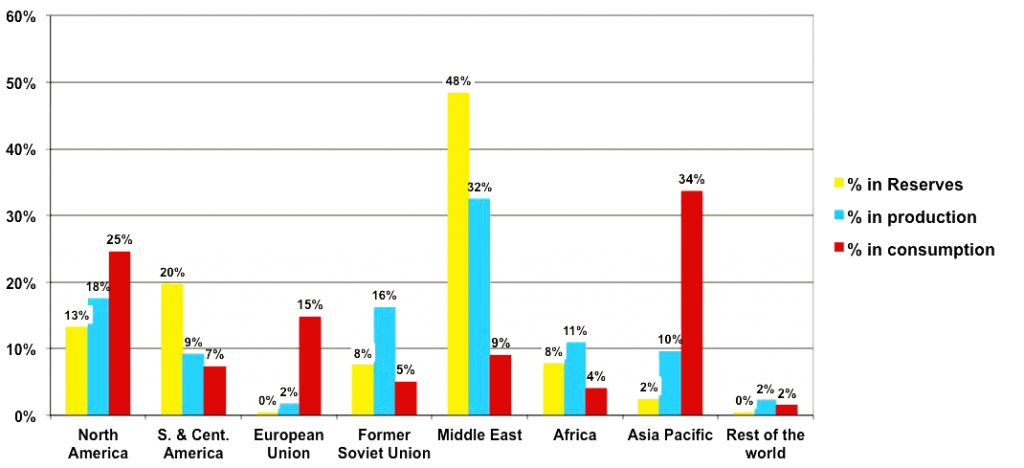
Share of the various regions in the world in the proven reserves, production, and consumption in 2012.
Some countries with low levels of reserves (Former USSR, North America) are still significant producers, but it could change within a decade or two.
These figures include non conventional oil, mostly located in Canada and in Venezuela. With its tar sands, Canada could detain 15% of the world reserves.
Source : BP Statistical Review, 2013
Saudi Arabia alone owns one fith of the world proven reserves (excluding canadian tar sands), and that Iran and Iraq each have 10% of the same total. This share of the Middle East in the world reserves is nothing new : this zone has been representing 55% to 65% of the world total for 30 years at least.
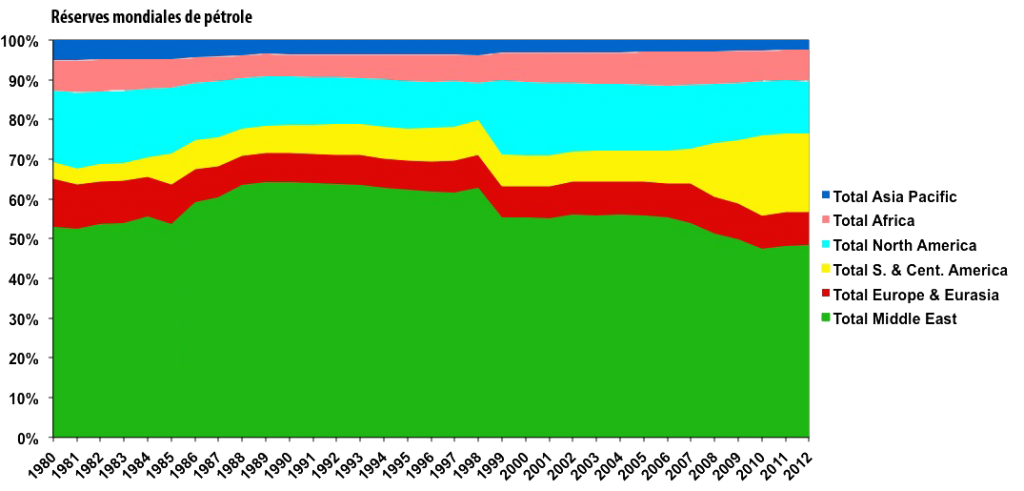
Share of each zone in the world total since 1980.
Most of the reserves for “Europe & Eurasia” are in Russia, and for a minor fraction in Kazakhstan and Azerbaïdjan. The sharp increase of Southern America comes from the beginning of production of extra-heavy oils in Venezuela, in the Orinoco basin.
Source : BP Statistical Review, 2013
Until when will the proven reserves grow ?
For the last 25 years, even though discoveries have declined and production risen (actually production seems to have stabilized since 2006), proven reserves have grown whatever part of the world is considered.
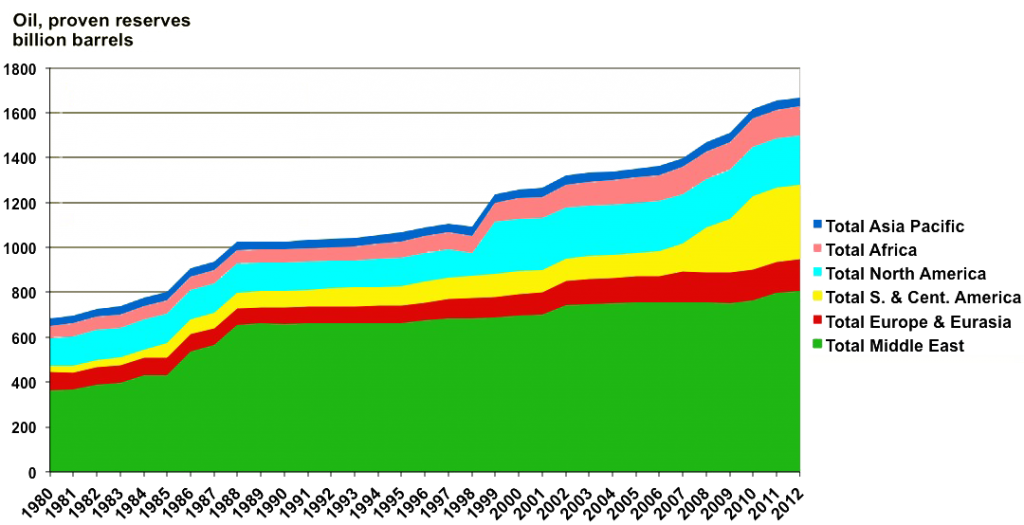
Regional proven reserves since 1980, in billion barrels
The sharp increase of Southern America in the late 2000’s comes from the addition of the extra-heavy oils in Venezuela, in the Orinoco belt, and the increase for Northern America in the late 90’s comes from the Canadian tar sands…
Source : BP Statistical Review, 2013
They have even grown or remained constant when expressed as a multiple of the production of the past year.
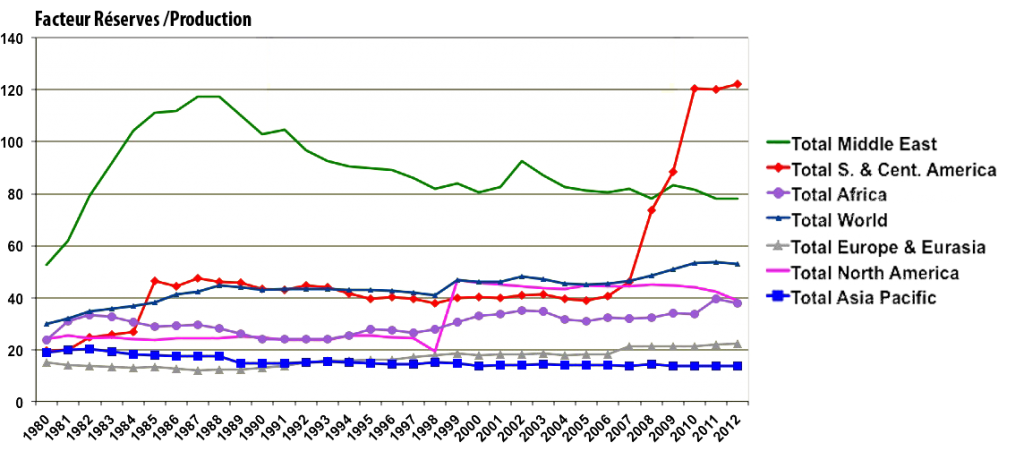
Ratio (reserves)/(production of the past year) (called R/P in short) for the various zones since 1980.
It is remarquable to note that this ratio has a strong tendeancy to remain constant or to grow, regardless of the zone !
Source : BP Statistical Review, 2013
Some geologists consider that this increase is an artefact, because the definition itself of proven reserves has no real meaning, and that another notion is preferable: backdated 2P reserves. With this notion (explanations in the bow below), then there has been a decrease in reserves since 1980, precisely when the consumption begun to outpace the rate of discoveries of extractible oil.
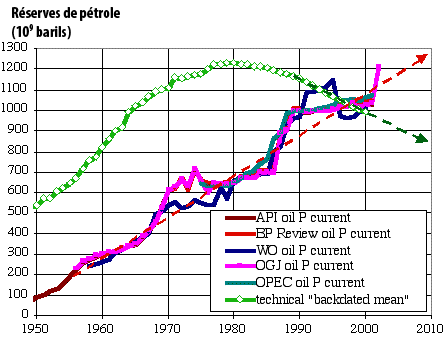
Evolution since 1950 of “reserves”, depending on the meaning of this word and the source. The unit is billion barrels.
“Current” is equivalent to “proven”, which means that all sources but one give an evaluation of world proven reserves, with slight differences. A new proven reserve is added when a new well is put in productio: the reserve is then the minimum amout of oil that is deemed to flow out of the well.
“technical backdated mean” uses a different method. “Backdated” means that the date at which a new reserve is taken into account is not the moment at which the corresponding portion of the field is put in production, but the date at which the first production well was drilled into the reservoir where a new well is drilled.
The normal way to proceed, when several wells are drilled into a single – but large – reservoir rock, is to associate to each of these wells an assessment of the oil that will come out from the said well, that is… a reserve. This reserve is taken into account when the well is drilled. The “backdated” method attibutes all the reserves associated to all the wells, normally published when the wells are drilled, to the year of the first drilling into the reservoir. The full reservoir is therefore taken into account on its first year of production.
Another difference is that the amounts for that curve correspond to 2P reserves, which are by nature subject to much more minor reappraisal than proven reserves.
When new wells are drilled in new portions of previously producing reservoirs, the backdated method does not increase the amount of reserves, when the “regular” method will.
Now what is the propper curve ?
Source : Jean Lahérère, 2003
What type of company owns the reserves ?
Interesting question, given the importance of oil in the industrial times ! Indeed, proven reserves necessarily belong to someone, as they correspond to fields that are in production, and then “someone” has been granted the right to install wells. Practically, the landlord can be:
- a state owned company, also named a national company ; all OPEC countries have one,
- a privatly owned company, and if several of them operate jointly a given field (very common case) each company will detain a share of the proven reserves of the field in proportion with its share in the operations.
And contrary to what a large fraction of Occidentals think, most of the oil on Earth is detained by national companies.
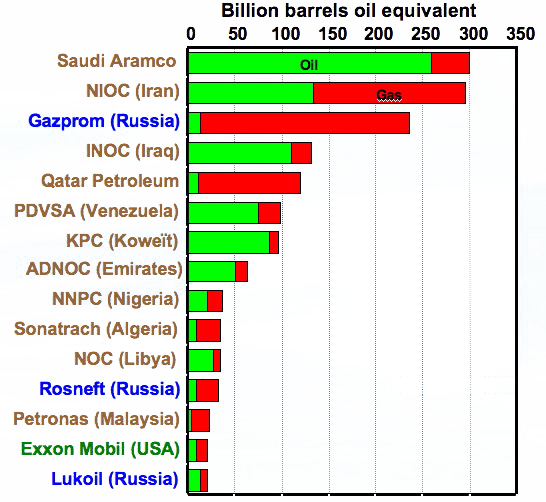
Largest owners of reserves, oil and gas together.
State owned companies are in beige, Russian companies in blue (a special category: they are theoretically privately owned, but in practical terms they act as if they were state owned), and privately owned international commanies in green (because they are well-known ecologists !). Exxon, with 1% to 2% of the world total (oil and gas aggregated), is ten times smaller than saudi Aramco, and European majors (BP, Shell, Total), with 1% of the world total in rough figures, do not appear here.
Source : PFC, 2005
Who checks reserves ?
Good question ! As for any information that is of crucial importance for the whole economic world, it is of some interest to know what degree of confidence can be put in the figures available. And, given the fact that energy is what puts in motion the physical world, and therefore is at the root of 100% of the GDP, accurate information regarding remaining energy stocks is probably even more crucial than accurate information regarding sovereign debt !
Now, for sovereign debt, we can discuss for weeks whether notation agencies work properly, but at least the borrower must grant access to a third party that will publish an opinion on the quality of the debt. For oil, we are not even there: for most companies in the world, and particularly for all national companies, there is no third party that has a free access to all technical information and publishes an “independent” advice on the figures publicly given by the company. Anyway, let’s start by the beginning: whichi company must publish what regarding reserves ? There are two main cases:
- for companies that are in the stock market, and particularly the NY Stock Exchange, publishing proven reserves is mandatory (the Securities and Exchange Commission has imposed it long ago), but this obligation pertains to only 10% of the world total, since 90% of the reserves are detained by companies that are state owned (see above),
- OPEC countries have exportation quotas that are proportional to the amount of proven reserves, and therefore publishing the latter is indispensable in order to enforce the global agreement between OPEC countries.
But :
- neither oil in place, nor remaining 2P reserves need to be published. It is therefore impossible to know whether the published proven reserves are irrealistic or cautious in the light of remaining oil in place,
- there is absolutely no obligation of having the technical data checked by an independent third party. Public companies do have certified acountants, of course, but these people are absolutely incapable – technically and because of a lack of time – of performing a thorough counter-expertise on log data from oil wells or images from seismic analysis. Sometimes (it has been the case for Shell a couple years ago) that a company has to decrease the amount of reserves, but it remains an exception, and in the case of Shell it was a basic mistake (oil coming from fields not yet in production, but that were about to be, was included into proven reserves).
Proven reserves are therefore not submitted to any organized process of external checking. There are of course external experts, like the ASPO members, that try to confront the published data to information they gather through other public sources… or through their personal network.
As the result of what is mentionned above, when a company or a country publishes proven reserves that never decrease, in spite of the lack of discoveries and reasons to greatly reevaluate the existing fields, you and me do not know whether this information is solid, or whether it is lying poker.
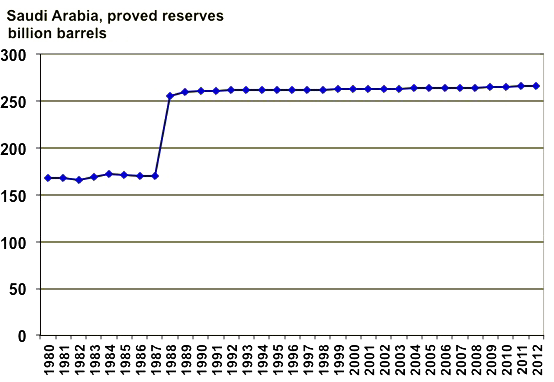
Evolution of the proven reserves published by Saudi Arabia since 1980.
Two things draw the attention on this graph :
- the major increase “overnight” in 1988, with no significant discoveries at the time. A possible explanation is as follows: during the counter-shock, when oil price was at historical lows, it was necessary to sell much more oil to keep significant export revenues. Well, for OPEC countries, as export quotas are proportionnal to proven reserves, the only way to increase significantly exports is to increase proven reserves !
- the remarkable stability of these reserves since 1990, as if the oil produced each year was exactely matching by new discoveries put in production – when occidental experts consider that there has been no major discovery since 1990 – and reevaluations.
Source : BP Statistical Review, 2013
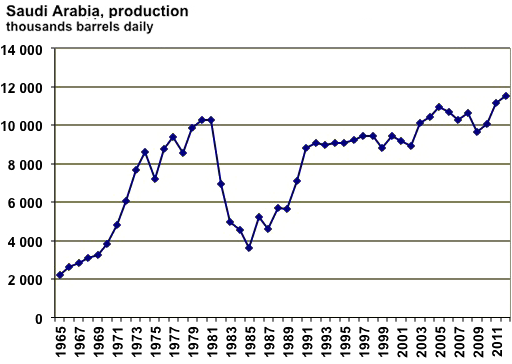
Saudi Arabia oil production from 1965 to 2012, in thousand barrels daily
The cumulated production from 1980 to 2012 reaches 100 billion barrels, which is 60% of the proven reserves of 1980… that have strongly increased since then !
Then one will notice that between 1988 and 2012 the oil production has varied between 6 and 11 million barrels daily, but the proven reserves have remained at the same level, as if every year a varying production corresponded exactely to the reserve growth because of discoveries and reevaluations !
Another intringuing thing is that the oil production of this country has slightly declined after 2005, even though oil price was surging at the time and the world was thirsty for more oil. But if there there are plenty of proven reserves, a high price and a lot of consumers willing to buy more, how can one explaine a decline in production ?
And, more generally, how can the external observer understand the signification of the apparent incoherence between this curve and the one showing a remarkable stability in proven reserves ?
Source : BP Statistical Review, 2013
To end this little overview on reserves, we can remember that, as often with technical and difficult matters, we will get the full story… only when it is too late to prepare the “post oil” era in good conditions. And, as every coin has two faces, we must also not forget that the more oil, gas and coal we have, and the more we risk a dangerous climate change…. nothing is simple !