Since humanity has built a trading system, and even more since economy has begun to be our major point of interest (making true the “prophecy” of de Tocqueville), predicting the price of this or that has come one of our favorite exercises. How is the price of real estate going to behave in this city ? How much will cost a car ? Paying for studies ? And… of course, in this list we will often put the price of oil, given the importance energy has taken in industrial civilizations.
Forecasting the price of the barrel has therefore been done an almost infinite number of times, and comparing what really happened with the forecast is genrally not very kind for the person that performed the task !
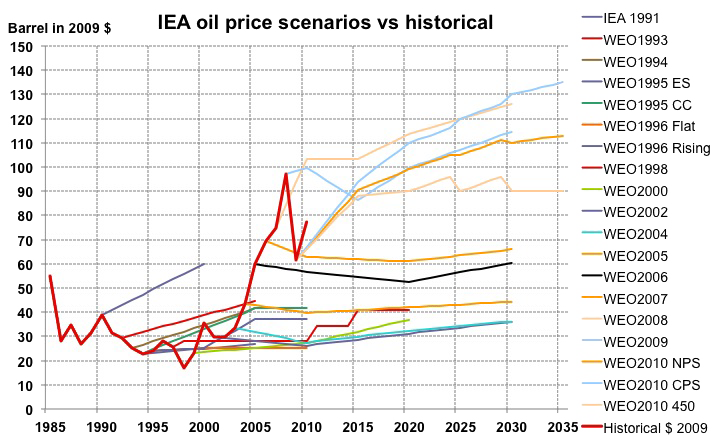
Evolution of the price per barrel in constant 2009 $ (red curve, legend “historical $ 2009”) and various forecasts performed by the International Energy Agency between 1991 and 2009 (each forecast bears the date of publication, with sometimes additionnal information that follows the year when several have been done).
Apart from the projections done in 1993 to 1995, that correctely gave the trend, not one prediction is accurrate !
Source : Olivier Rech, Carbone 4, 2011
Therefore what follows is nothing close to predicting the price of oil for 2037, and March 6th at 10 am to be precise. It is just an attempt to explain what are the components of oil price, and therefore what can be said or not on their future evolution.
Technical costs
Everybody will have noticed than to be able to use oil, a good start is to extract it from the ground. As oil companies are generally not philanthropists, they try to include the technical costs of recovering oil into the market price. Technical costs include upstream operations (exploration, development) then operating costs once the infrastructure is in place. All this amounts to 5 to 10 dollars per barrel in most cases for conventional oil.
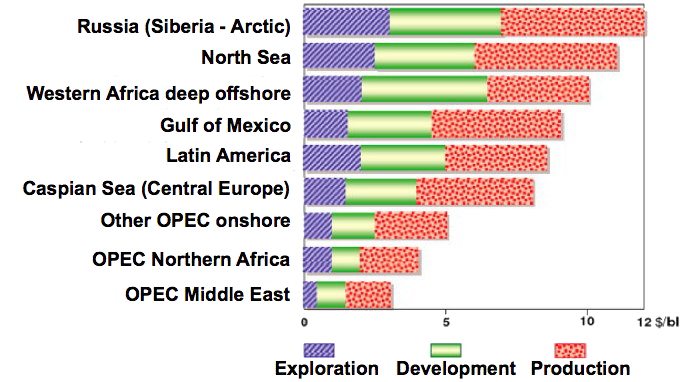
Technical cost of conventional oil production.
Developpement is building the production infrastructure.
Source : ADL, Long term Outlook, 1999, In Bauquis & Babusiaux, Académie des Technologies, 2007
From 10 dollars per barrel, these costs could jump to 50 or even 100 in future complex situations (enhanced recovery, deep offshore, extra-heavy, etc). Since 2000 the upstream costs have already been multiplied fourfold when the amounts of oil found have not followed.
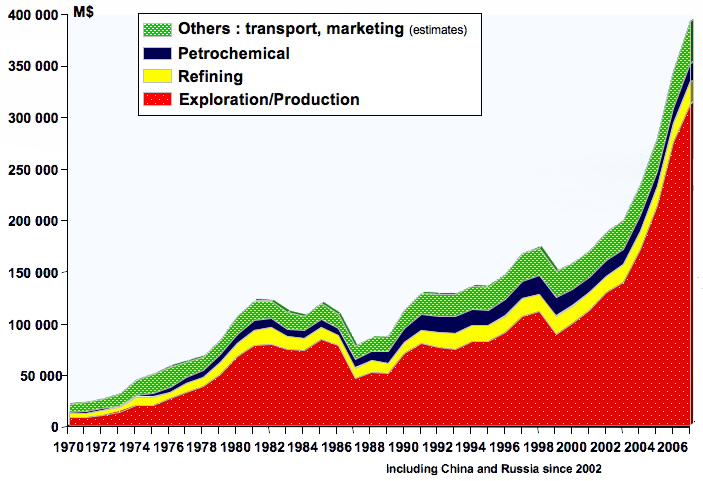
Investments of oil companies, in million dollars, by sector.
From a minority fraction in the 70’s, exploration and development costs have become dominant.l actuellement, alors qu’en 1970 elles étaient minoritaires dans l’ensemble.
Source: IFP & CEG, November 2007, in Pierre-René Bauquis, Total Professeurs Associés, 2008
10 dollars per barrel of technical costs means 6 to 7 cents per litre of oil product. A simple multiplication then brings us to the conclusion that if technical costs increase to 100 dollars per barrel, the price of a litre of fuel – of whatever type – will increase by 50 to 70 cents. Each of us will decide whether it is a lot or not !
Oil = rent and taxes
In production costs, the dominant fraction is not technicial costs, though, but the rent (which is a tax by nature) paid to the country where the oil is extracted, and that represents the triple (roughly 30 cents per litre of oil). The corresponding money is then used to finance public spending in the producing country (education, health, defense, transportation infrastructure, etc), and experience shows that once people are used to a certain level of spending, they have a hard time – just like us ! – accepting that it decreases.
But the fate of any oil production is to decline some day. If the “taxes” per barrel remain similar, then the fiscal revenues of the producing countries will decrease. Question: will these states then review the sharing agreements they have with oil companies, to increase the amount they get per barrel ? If so, who can predict by how much, and whether the oil companies will “pass through” the increase, or decrease their margin, or both ?
Then come the consumers. In the countries that have begun the industrial era as oil importers, there are generally hgh taxes on car fuels, around several tens cents per litre (the amount is very similar from one country to another in Europe, precisely because all European countries began the car era as oil importers). The idea of these significant taxes was precisely to limitate consumption to limitate imports. These taxes have then become a significant fraction of the fiscal revenues of some Occidental countries (in France the interior tax on oil products represents roughly 10% of the fiscal income of the state).
Question: how are these taxes going to evolve in the future ?
- If fighting climate change is or remains a significant goal, it would be logic that these taxes increase, and this increase has no particular reason to be correlated with production costs,
- If the name of the game is to limitate imports, because the latter create a huge commercial deficit, it would also be logical that these taxes increase, and this increase has no particular reason either to be correlated with production costs,
- If the importing state has not anticipated the consequences of the peak of oil production, then he will experience repeated recessions, and this will both create the need to find fiscal revenues based on flows that are rather invariable in the short term in spite of the recession (and part of oil use is like that) and… a political context that will not make it easy to raise taxes on car fuels when there is both a rise in unemployement and a decrease of the purchasing power.
As many other coupling mechanisms can be thought of, the answer to this question – on the evolution of taxes in consuming countries – could be as well obtained by looking at the stars !
A market = a supply + a demand
And at last most of the oil trade – and 100% of imports in Occidental countries – is done throught “markets”, that is places that put face to face buyers and sellers. Oil is bought and sold just like a share on the stock market. And forecasting prices on the stock market is an exercice for which more than one economist proved wrong !
But there is an interesting correlation that can be observed over the last 9 years, and that might allow to predict that prices… wont remain still. Indeed, since 2000 the price of oil is a reverse function of the unemployed capacity of OPEC (oil exporting) countries.
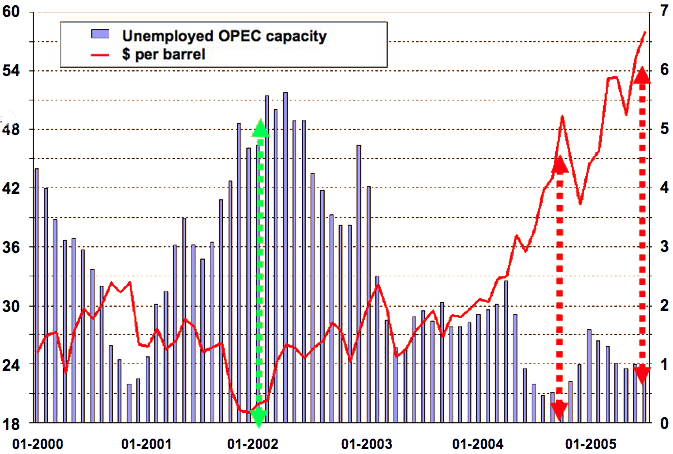
Red curve : price of oil, in dollars per barrel (left scale). Blue bars: spare capacity of the OPEC countries, in million barrels daily (right scale).
4 million barrels daily of spare capacity means the OPEC production can increase, almost overnight, by 4 million barrels daily, which is roughly 5% of the world production. Actually this unemployed capacity is located in a restricted number of countries (among which Saudi Arabia), and if oil demand increases then this spare capacity gradually decreases. When it falls below 2 million barrels daily the orice begins to surge, and it does so until enough demand is destroyed by a high price.
The decrease of this spare capacity in 2000 triggers a price increase – moderate though – but the early 2005 decrease triggers a much more important one, and in 2008 (which is not shown on this graph) the process was the same.
Source: IFP & CEG, November 2007, in Pierre-René Bauquis, Total Professeurs Associés, 2008
- The correlation mentionned above allows to say that it is very unlikely that the price of oil keeps quiet, but it is also very unlikely that it remains very expensive for a long time period. Indeed, when the price of oil surges, it means that the economy has not enough oil, and then all or a fraction of the world economy goes into recession. As a result the demand decreases… and the price also, which triggers an increase of demand ! The most likely for a certain number of years or decades is a coupling between GDP and oil that creates a “wobbling price” and a “wobbling GDP” which is illustrated with the graph below.
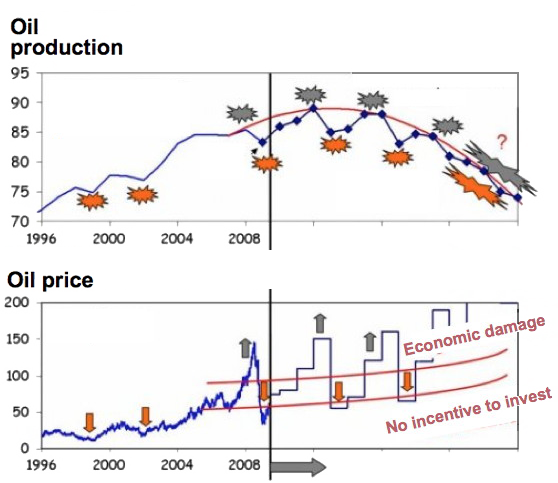
The upper graph represents the maximum possible oil production (in orange) and the consumption (in blue). The price is on the lower graph, with dates that match.
When the price is high it means that supply is not sufficient to fulfill the desired consumption, and then the economy destroys demand by a mixture of high price and recession. As a result the price gets lower, allowing a rise in consumption, then an increase of the GDP, until consumption hits again the “production ceiling”, triggering an increase in the price, and the same cycle starts again.
One of the effects of this cycle is that private economic agents – that have a hard time figuring the speed at which the price of oil will rise again (and don’t like to consider this idea anyway !) – don’t want to invest to save energy when the price is low, which in addition now generally goes with a depressed economy.
Therefore the dependancy on oil doesn’t decreases fast enough, and when the next price surge comes, the damage comes again, now more important than the previous time, because the economy will have weakened without enough time to recover. Damned market economy !
In this kind of context, predicting a price without mentionning the year and month is both difficult and… not very relevant anyway !
The only reasonnable conclusion that we might come to given what has been exposed above is that in a constrained world the price of oil will neither be low for long times, nor high for long times, but… more and more volatile. This volatility will go along with repeated recessions as long as we have not converted the world energy system, which can take a certain time…
In the very long run, we are nevertheless certain that the price of oil will be… nil ! Indeed, one time will come when either we are all dead, or oil has become useless. In both these cases the price of oil is zero (without consumers there is no price). But by the time we get there it’s not hard to predict that the boat will be a little rocked…