If this question is asked to the average car driver, we all know the answer: oil has always been more expensive, since the price paid at the pump has always been rising ! And most of the time our driver is right to think soif we look at current prices, that is what is paid in money of the day to buy a barrel of oil.
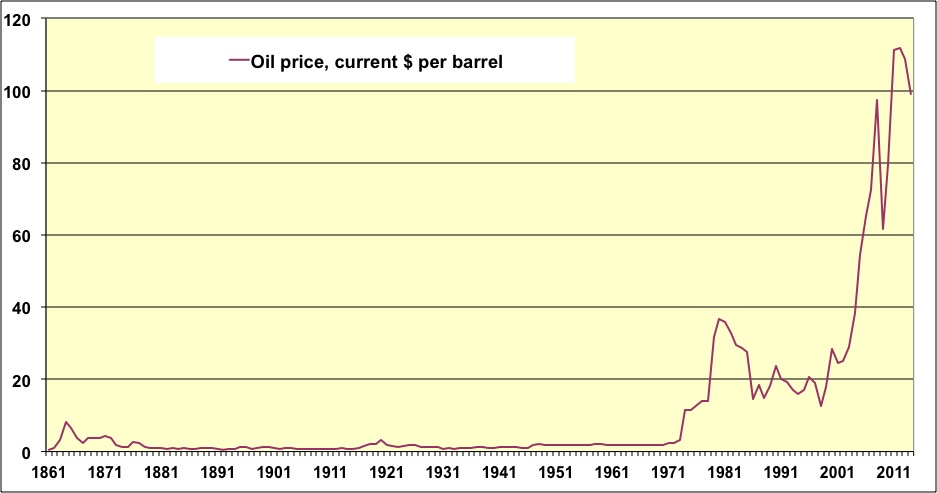
Price per barrel, in money of the day., from 1861 to 2012.
Obviously the trend is more upwards than downwards, particularly after 1970.
Source : BP Statistical Review, 2015
But a first thing that our car driver forgets is that prices have a tendancy to increase over time, a process which is named inflation. A first interesting thing to do is then to shift from current prices (or prices in “money of the day”, that is what is written on price tags) to prices in “constant money”. Going from money of the day to constant money is done by remonving inflation, that is the price increase over time for a product that remains the same (a pound of tomatoes, a pair of glasses, etc). This operation does not account for the increase in revenues that occur in the same time, just for the fact that a dollar of 1980 is less valuable than a dollar of 1960, but more than a dollar of 2000.
Then, surprise !
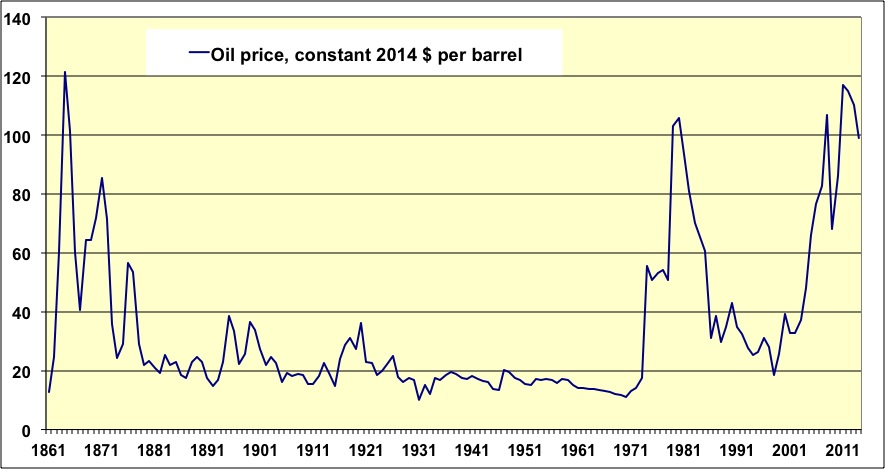
Constant dollars per barrel of oil from 1861 to 2012.
The price of oil did not go any higher in 2008 than in 1979…. and not higher in 2011 than in 1864 !
Source : BP Statistical Review, 2015
The 2008 oil shock did not correspond to a “historical” threshold: in constant money, that threshold had already been crossed in 1979, and in 1864, but it is true that there was not the same number of car drivers in the world during the end of the 19th century. The 1864 oil spike therefore did not remain deep in our memories !
Looking at the price in constant money gives a much more realistic appreciation than money of the day, but we do not have the full story yet: the “real price” of an object is not even its price in constant money, but the fraction of what one earns that is necessary to purchase the said object. This “real price” of a good or service is more or less the amount of time one has to work to earn what is necessary to buy the good or service. Indeed, the only thing that did not change over centuries is the fact that we only have 24 hours per day. Expressing prices in “working time required to buy something” is the only relevant way to compare these prices over time. And then, surprise again !
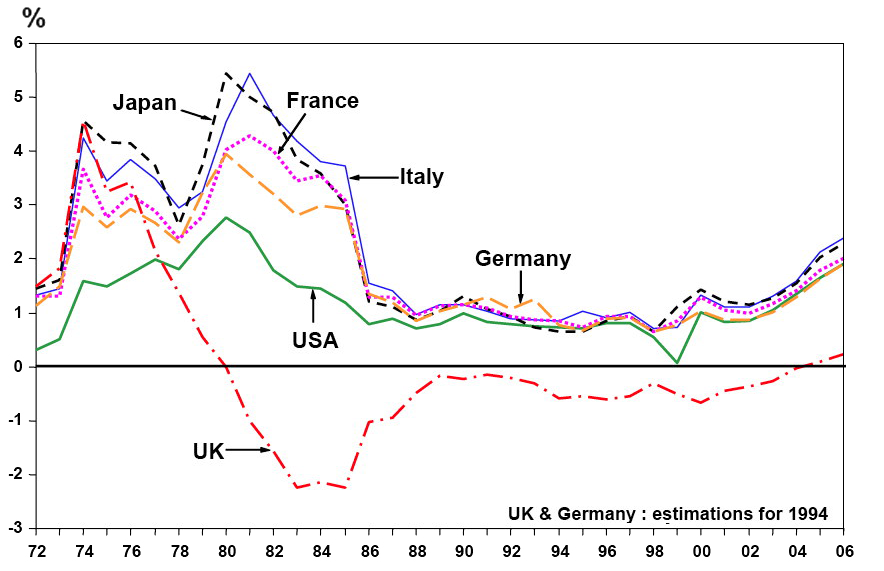
Evolution of the net oil bill as a share of the GDP for a selection of OECD countries, from 1972 to 2006.
Countries that have turned from importers to exporters (UK) have seen their bill turn “negative” as long as they have been net exporters. For countries that never produced anything significant (France, Japan, Italy) it is obvious that this bill has been the highest at the time of the second oil shock.
Source: Pierre-René Bauquis, Total Professeurs Associés, 2008
As an example, if we look at the oil bill of France, which imports 99% of its consumption, we do not have the same result whether we express it in constant money, or as a share of the GDP, which is close to the fraction of the working time (per individual) we need to devote to purchasing our oil. The amount of oil purchased was 120 millions tonnes per year in 1979, down to 85 in 1985, then it grew again to 95 in 2000 before going down again to a little less than 90.
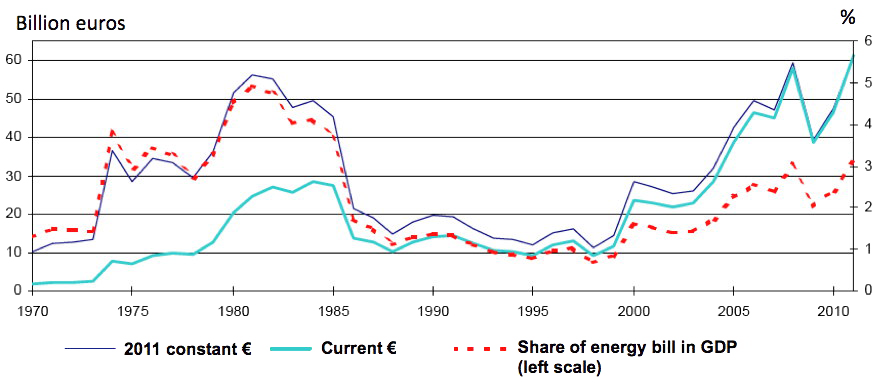
Evolution of the oil bill for France since 1970.
The real oil price, expressed as a fraction of the GDP – that is the working time we need to devote to buy a given product – is today much lower than what it was in 1979.
Source : French Ministry of Sustainable Development, 2012
You might have noticed, though, that most people in the street do not buy crude oil. In France, as elsewhere, ordinary people buy refined product, and first of all for transportation needs. What we buy in such a case includes refinery margins, transportation and distribution costs (gas pumps), and… taxes. This fraction of the price for the end-consumert represents twice the price of oil itself (but my point is that it is still not enough !). From a consumer point of view, the interesting information is to look at the full price, in constant money.

Price of car fuels in France since 1970, in constant 2010 euros.
Source : French Ministry of Sustainable Development, 2011
And this graph brings again a new conclusion ! Since 1970 the price of car fuels in constant euros has increased only by 15% for unleaded gasoline. For diesel it has risen more, but in France it is mostly due to the fact that the amount of taxes for diesel has been levelled to what was applied for gasoline.
But in the same time the GDP per capita, which basically represents our purchasing power, has doubled. Therefore, in real terms, the average French pays his gasoline about twice cheaper today than before the first oil shock. Even for diesel the real price is lower than it was before the first oil shock, even though the amount of taxes has risen significantly.
And for someone paid at the minimum wage, for whom the revenue has tripled and not doubled, the real price of gasoline has been divided by 3. So gasoline would be at a historical high, really ?
More generally, if we look at the share of energy in household spendings, we can see that it is lower today than before the first oil shock.
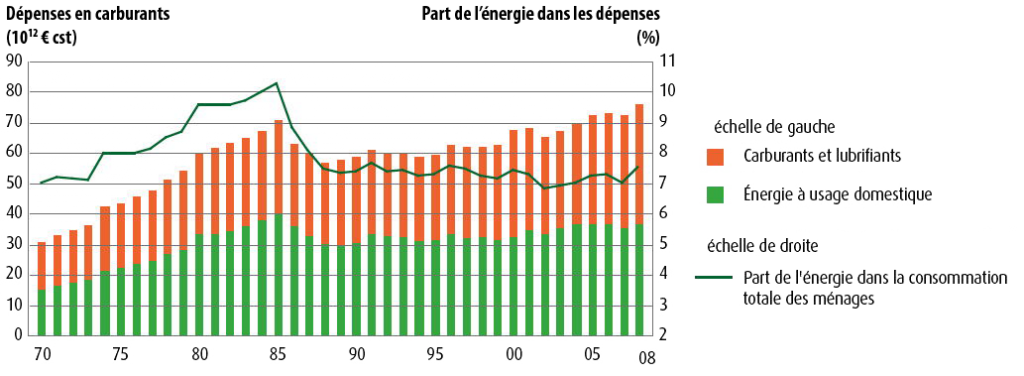
Evolution of the household spendings in car fuels (pink curve) and in domestic energies – electricity, gas, domestic fuel oil (dark blue curve) in constant billion euros (left vertical axis). The orange curve coresponds to the share of the household budget that is spend in energies at large (in %, right vertical axis).
Surprise ! In real terms, that is compared to what we earn, energy is cheaper and cheaper…
Source : French Ministry of Sustainable Development, 2011
In the same time that real prices decreased, the final energy consumption per French has risen by 20% to 30% (this consumption excludes the energy embedded in goods and products bought by end consumers), and in this total electricity has been multiplied by 6. This will lead to a conclusion consistent with what is mentionned above, which is that over over several decades real energy prices have been slashed by a factor 2 to 3, when everyone thinks that it is more and more expensive !
And before?
As oil has been pumped from the ground for far more than a century now, buying car fuels has not begun in 1970. At that time there were already 200 million cars on Earth, and 10 millions in France. But statisticians were not as effective as today, so we lack series that would begin in 1900 regarding car fuel prices. But we do have a time series on oil price which is that old, and even older: as the second graph of this page shows, the price of that precious liquid in 1880 – in constant money – was equal to its price in… 1998. But in the same time the GDP per capita was multiplied by 8 to 10 in the US, which is considered to be almost representative of industrial countries (it has even been multiplied by 20 if we go back to 1850).
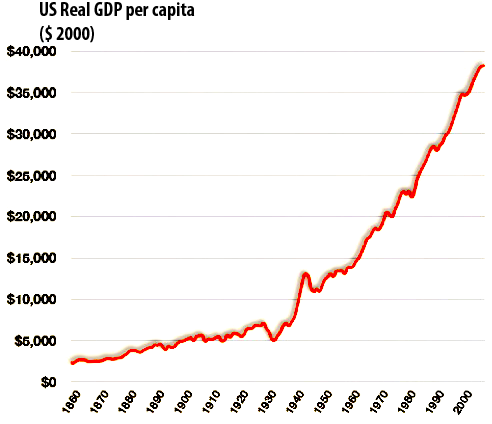
GDP per capita in the US since 1860, in constant 2000 dollars.
Let’s recall that national accounting – in which the GDP is one of the aggregates – did not exist before 1945, and that figures given before that year are reconstitutions from other data.
Source : Johnston & Williamson, “What was the US GDP then?“, MesuringWorth, 2008
With a GDP per capita multiplied by 10, and a price of oil that remained about constant in constant money, the conclusion is simple: the real price of oil has been divided by 10 for a US citizen. In the same time, the efficiency of oil use – the amount of mechanical energy or the number of degrees in a room you can get for the same amount of oil – has been multiplied by several units, let’s say between 3 and 10. For cars, for example, in half a century technical progress has allowed a multiplication by 8 to 20 of the service you can get out of the same amount of oil, depending on what you count (power or kinetic energy, see below)

The French car of 1950 : an engine of 375 cc, 9 horsepower (6 kW), max speed of 60 km/h (roughly 36 mph), 500 kg (a little over half a ton), and 4.5 litres of gasoline for 100 km (≈ 50 miles per US gallon).
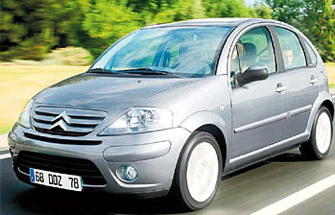
The French car of 2008 : an engine of 1400 cc, 70 horsepower (50 kW), max speed of 160 km/h (roughly 100 mph), 1000 kg (1,1 ton), and… 5 to 6 litres of gasoline for 100 km (≈ 40 to 45 miles per US gallon).
When we go from left to right, for a gasoline consumption that has remained about the same, we move twice the mass, at a max speed multiplied by 3, get 8 times the engine power, and 20 times the kinetic energy at full speed.
We have seen above that in the same time- since 1950 – the real price of a litre of gasoline has been divided by 2 to 3. With a “mechanical efficiency” mutliplied by 10 to 20 in the same time interval, we get to that astonishing conclusion that in half a century the real price of a mechanical kWh derived from oil has seen its price multiplied by 30 to 60 ! And oil would be more expensive for the end consumer ?
30 billion barrels and me…
After this little analysis, that shows that our “intuitive” opinion on the price of oil products is totally wrong, let’s end with a little calculation: a comparison of the price of one kWh coming from oil with one kWh coming from… our muscles.
A well-trained man can, at most, yield half a kWh per day of mechanical energy when using his legs, and 10 times less when using his arms (see details here). If this worker has been paid at the minimum wage in occidental countries, say 15 euros or dollars per hour (payroll taxes included), one kWh of mechanical energy will cost about 200 euros (or dollars) with legs, and 2000 with arms. Well, in a litre of gasoline there are 10 kWh of thermal energy (through combustion), of which an engine will get 2 to 4 kWh of mechanical energy.
With gasoline costing about 1 euro (or 1 dollar) per litre, a mechanical kWh coming from oil will then cost 25 to 50 cents, that is…. 500 to 10,000 times less than a mechanical kWh coming from human muscles in industrial countries. Let’s be now totally immoral: even with slaves, that nobody pays, but that still have to be maintained alive, which means feeding them, a roof (particularly in the mid-latitudes in winter), defending them against predators and diseases, etc, a rough calculation would show that a mechanical kWh still costs several euros at least, that is 10 to 100 times more than with an engine. A 100 horsepower (70 kW) tractor provides the same power than 100 horses or 1000 farm workers ; no wonder rural areas emptied !
So the final word on the price of oil is now easy to get: given the fact that fuels have enabled a multiplication by 100 to 1000 of our ability to transform our environment (because mechanical energy is nothing else than the ability to create physical flows that will change the environment), the price of fuels is not high, it is nil. The only good question is to know what will happen when this stops to be true…