Non OCDE countries gathers all countries… that do not belong to the OECD (which stands for “Organisation for Economic Co-operation and Development”, and gathers North America – Mexico included, most European countries, Japan, South Korea, Chile, Israel, Turkey, and Australia).
Non OCDE countries therefore include all “large emerging countries”, such as India, Brazil, Russia, all Middle East except Israel, South Africa, but most of all China. As this country uses almost a quarter of the world energy consumption, I have looked at the trends if China is separated from the rest of the zone.
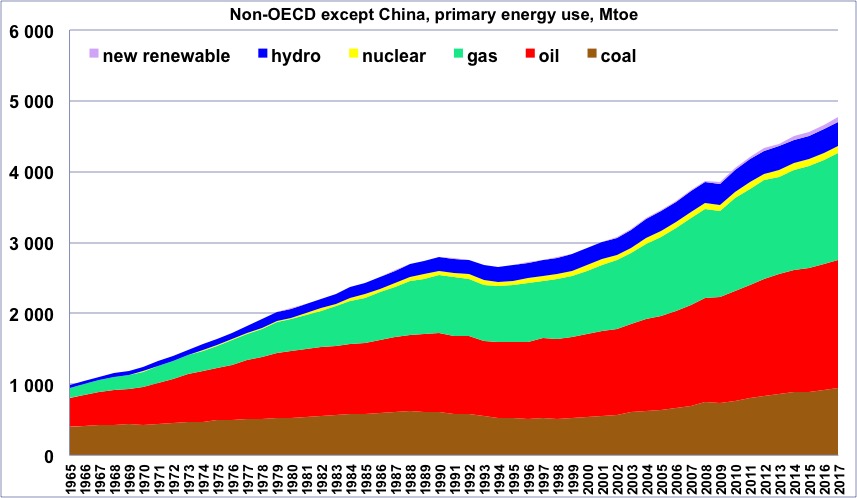
Primary energy consumption of non OECD countries except China, wood excluded, from 1965, in million tons oil equivalent.
(one ton oil equivalent = 11600 kWh).
“New Renewable” = all renewable energies except wood and hydroelectricity.
Author’s compilation on primary data from BP Statistical Review
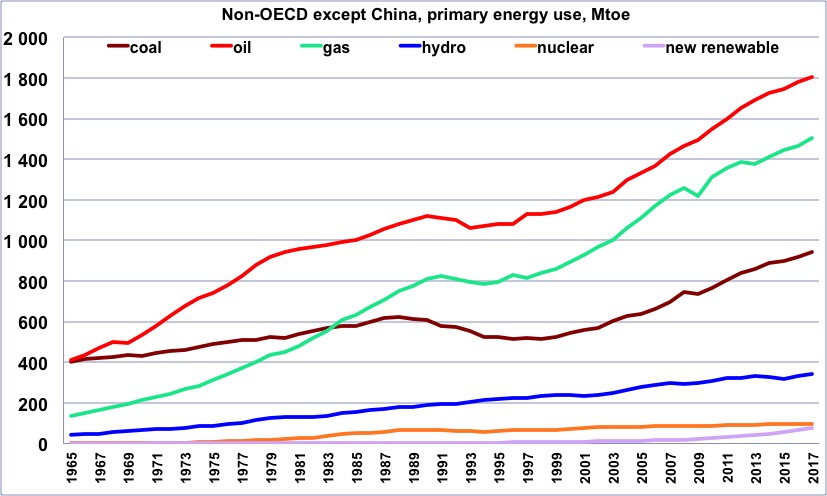
Same as before, but with one curve per energy.
One will notice that oil is the dominant energy in this part of the world (same as in OECD countries), and that no energy is declining so far.
Author’s compilation on primary data from BP Statistical Review
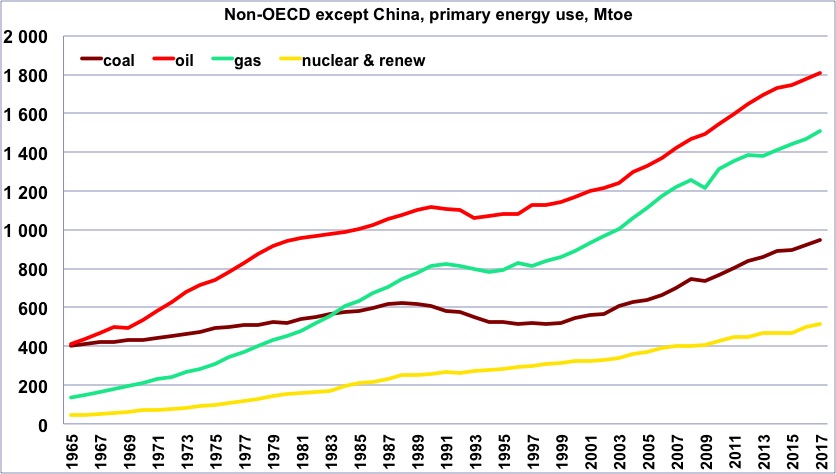
Same as before, but with a curve that totals all “non fossil” production (“non fossil” is anything except coal, gas and oil, and is therefore the sum of nuclear and renewables).
The rise of this contribution is mostly due to the rise of hydroelectricity.
Author’s compilation on primary data from BP Statistical Review
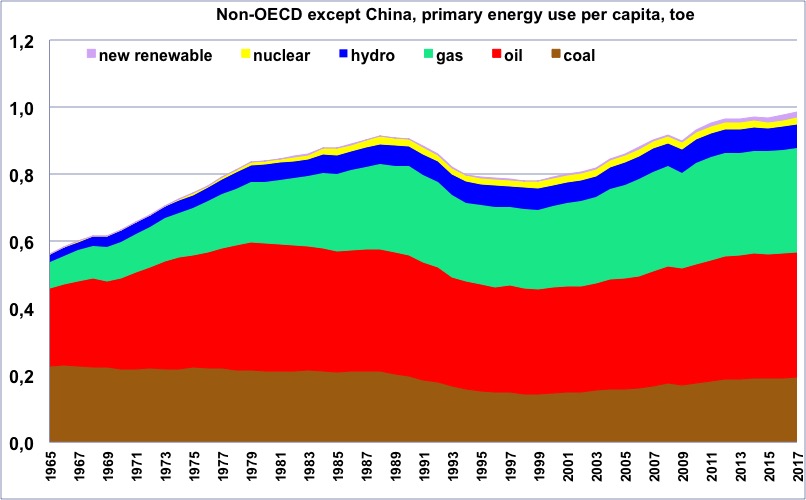
Primary energy consumption per capita in non OECD countries except China, wood excluded, from 1965, in tons oil equivalent.
(one ton oil equivalent = 11600 kWh).
“New Renewable” = all renewable energies except wood and hydroelectricity.
Author’s compilation on primary data from BP Statistical Review
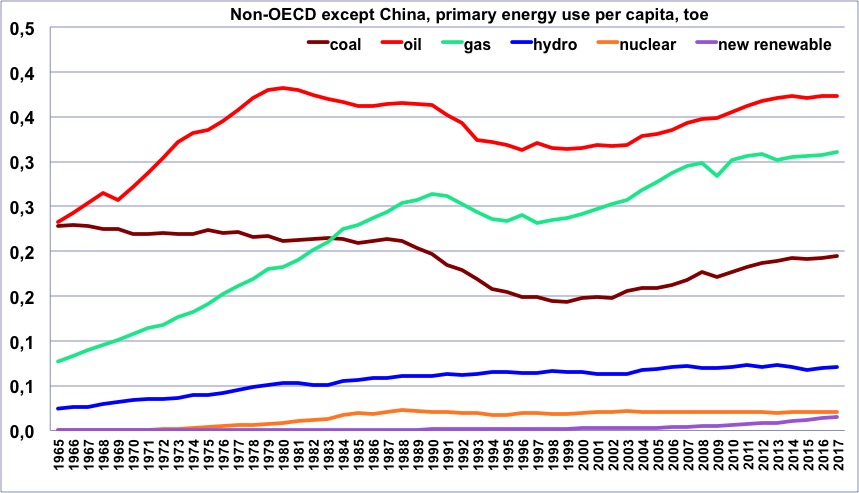
Same as before, but with one curve per energy.
Author’s compilation on primary data from BP Statistical Review & World Bank
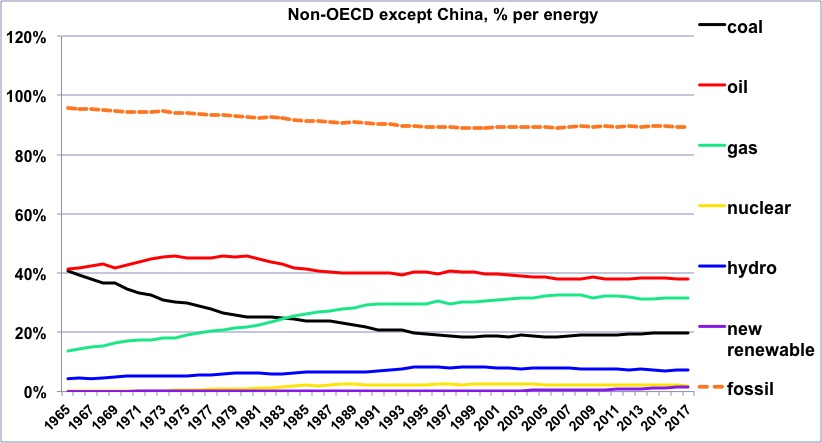
Share of each energy (wood excluded) in the non OECD countries except China consumption since 1965, and share of the fossil fuels.
One will notice that the share of coal is greater than the share of oil, when it is the opposite in OECD countries. One will also notice that except for hydroelectricity, the non fossil energies are almost inexistant (nuclear included).
Author’s compilation on primary data from BP Statistical Review
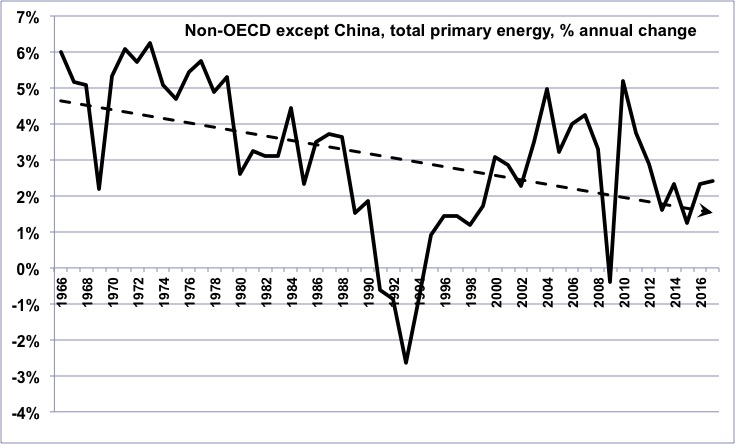
Annual change of primary energy use in non OECD countries except China since 1965.
Countrary to what happened in OECD countries, there is a decreasing then an increasing growth rate over the period. Are we witnessing a new decrease in the recent years?
Author’s compilation on primary data from BP Statistical Review
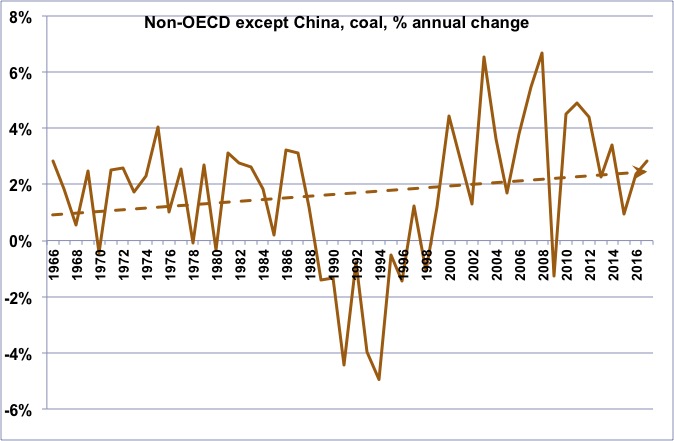
Annual change of the coal consumption in non OECD countries except China since 1965.
Contrary to what happens in OECD countries, the trend over the period is a growth (of the growth rate).
Author’s compilation on primary data from BP Statistical Review
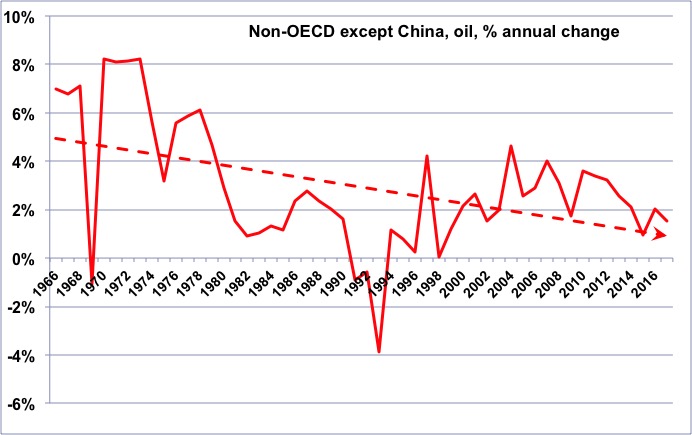
Annual change of the oil consumption in non OECD countries since 1965.
Although the trend over the period is a decline of the growth rate, there are clearly two distinctive episodes, one of a rapid decline (until 1990), then one of a rise again.
Author’s compilation on primary data from BP Statistical Review
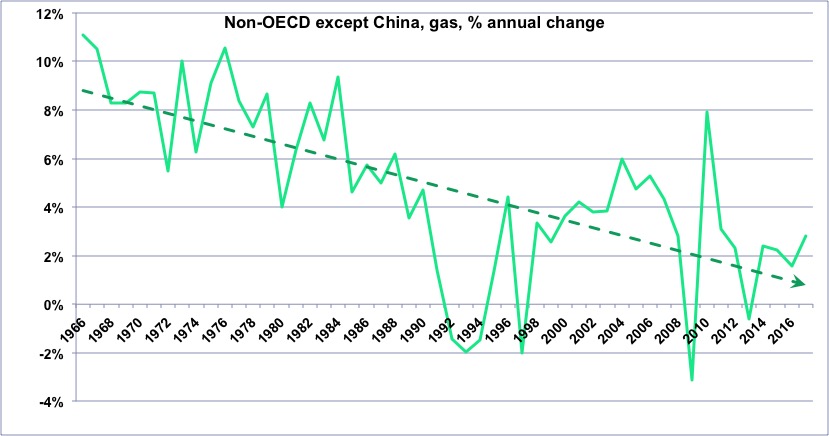
Annual change of the gas consumption in non OECD countries since 1965.
Although the trend over the period is a decline of the growth rate, there are clearly two distinctive episodes, one of a rapid decline (until 1990), then one of a rise again.
Author’s compilation on primary data from BP Statistical Review
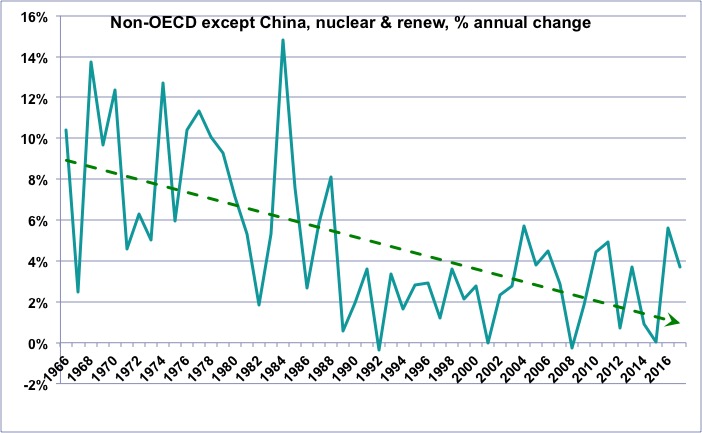
Annual change of the “non fossil” (wood excluded) consumption in non OECD countries except China since 1965.
The trend over the period is a decline of the growth rate, and the “new renewables” do not allow to sustain the growth rate that prevailed with hydro (there is not much nuclear in the zone).
Author’s compilation on primary data from BP Statistical Review
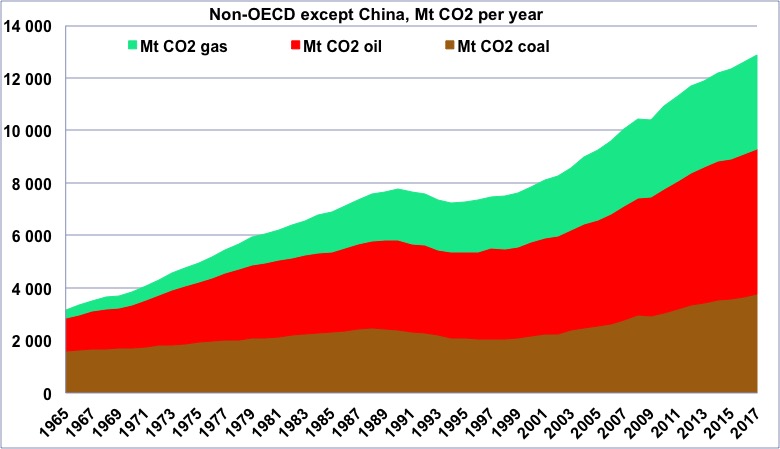
CO2 emissions coming from fossil fuels in non OECD countries except China since 1965, in million tonnes.
The total amounts to one third of the world emissions, and contrary to OECD countries it is rising fast.
Author’s compilation on primary data from BP Statistical Review
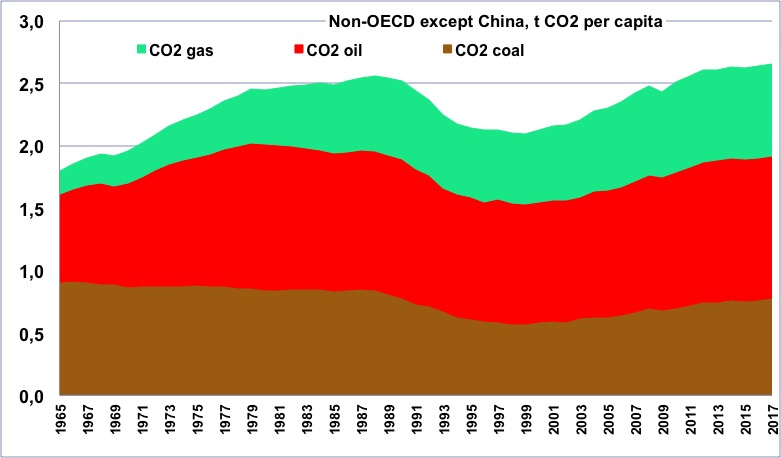
CO2 emissions per capita coming from fossil fuels in non OECD countries except China since 1965, in tonnes.
Contrary to what happens in OECD countries it is rising fast, and oil gives the dominant contribution.
Author’s compilation on primary data from BP Statistical Review
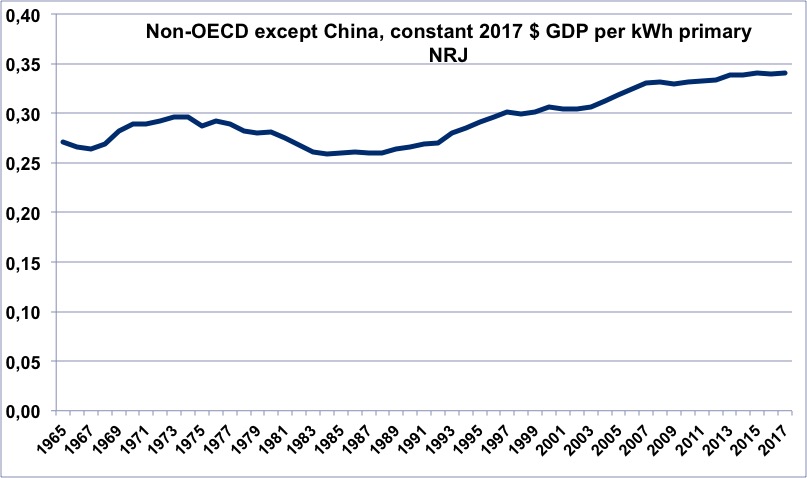
Evolution of the energy efficiency of non OECD countries except China since 1965 (constant dollars of GDP per kWh of primary energy).
When the value is increasing, it means that the economy is becoming more efficient.
Contrary to what happened in OECD countries, this ratio has not constantly improved over the period. Actually, except for a 20 year period going from 1985 to 2005, it has remained constant or degraded.
Author’s calculation on primary data from BP Statistical Review, and World Bank
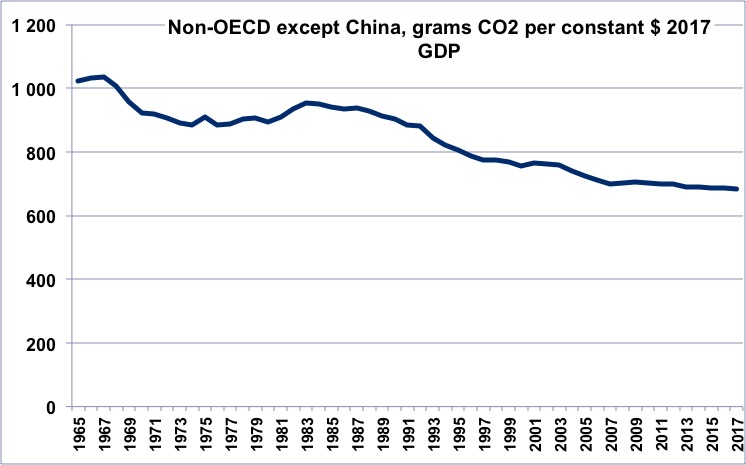
CO2 efficiency of the economy of non OECD countries except China since 1965 (grams of CO2 per constant dollar of GDP).
When the value is decreasing, it means that the economy is emitting less per unit of GDP. The present value is about twice what it is for Europe.
Author’s calculation on primary data from BP Statistical Review, and World Bank
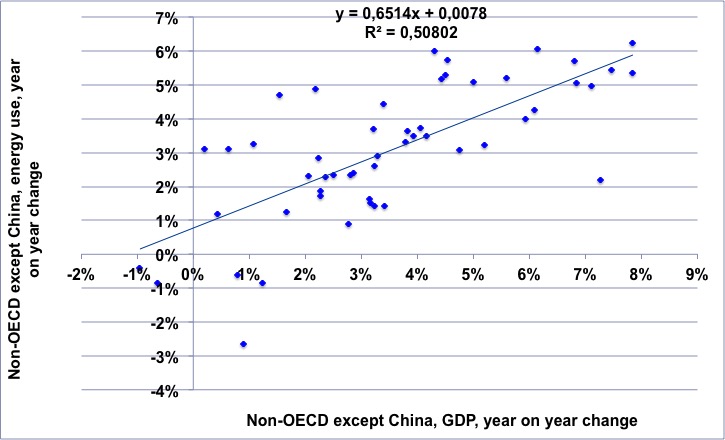
For the 1965-2017 period, annual change of the GDP of the non OECD countries except China (horizontal axis) vs. annual change of the energy consumption of the non OECD countries except China.
The intersection of the regression line and the vertical axis means that for a constant GDP there is a 1% increase of the energy consumption, and the 0,6 slope that for any percentage point of GDP growth there is the need of a 0,6% growth of the energy consumption.
Author’s calculation on primary data from BP Statistical Review, and World Bank
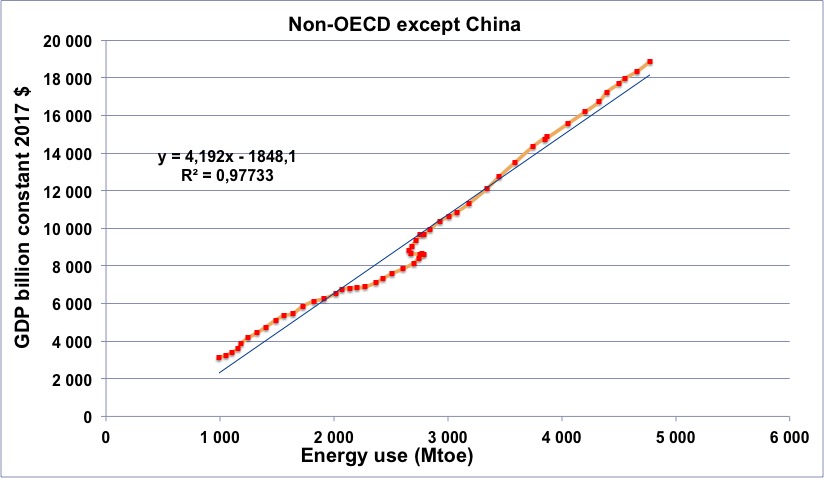
Non OECD except China energy consumption (horizontal axis) vs non OECD except China GDP (in constant billion dollars) for the period going from 1965 to 2017 (the orange line begins in 1965, at the lower left, and then the dots follow a chronological order going roughly up and right).
Contrary to was can be seen for OECD countries, this curve shows almost no “accidents”, and has remained remarkably linear for the time being.
Author’s calculation on primary data from BP Statistical Review, and World Bank
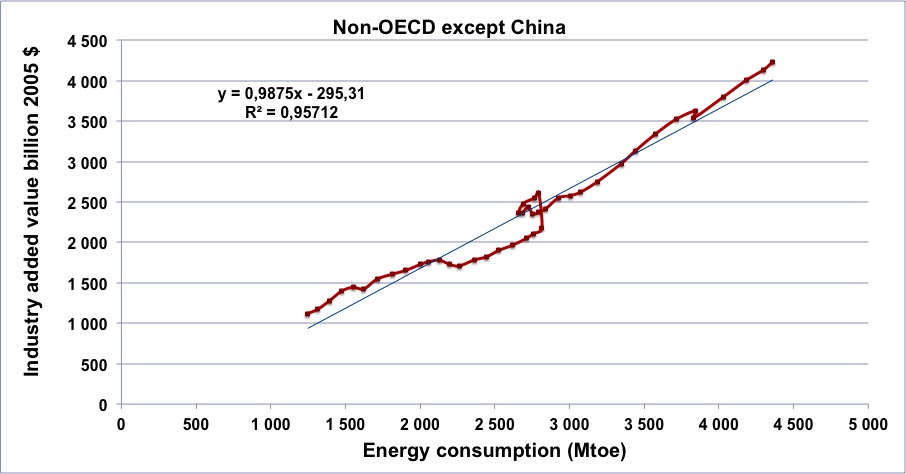
Non OECD except China energy consumption (horizontal axis) vs non OECD except China industrial output (in constant billion dollars) for the period going from 1970 to 2014 (the brown line begins in 1965, at the lower left, and then the dots follow a chronological order).
The curve is almost a straight line for the whole period, contrary to what can be observed for OECD countries.
Author’s calculation on primary data from BP Statistical Review, 2015, and World Bank, 2015
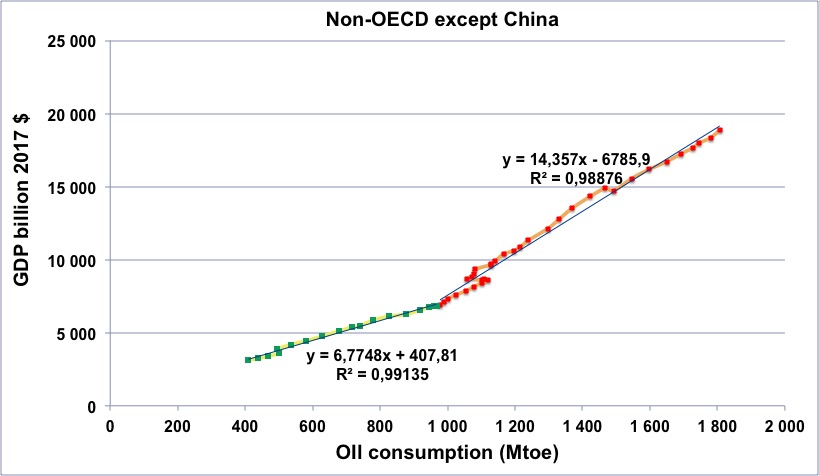
Non OECD except China oil consumption (horizontal axis) vs non OECD except China GDP (in constant billion dollars) for the period going from 1965 to 2017.
Green dots with yellow line: 1965 to 1982.
Red dots with orange line: 1983 to 2017.
The 1974 and 1979 episodes are invisible, as the 2006 episode. The “oil efficiency” has improved after 1980, but the “oil dependancy” has not disappeared !
Author’s calculation on primary data from BP Statistical Review, and World Bank
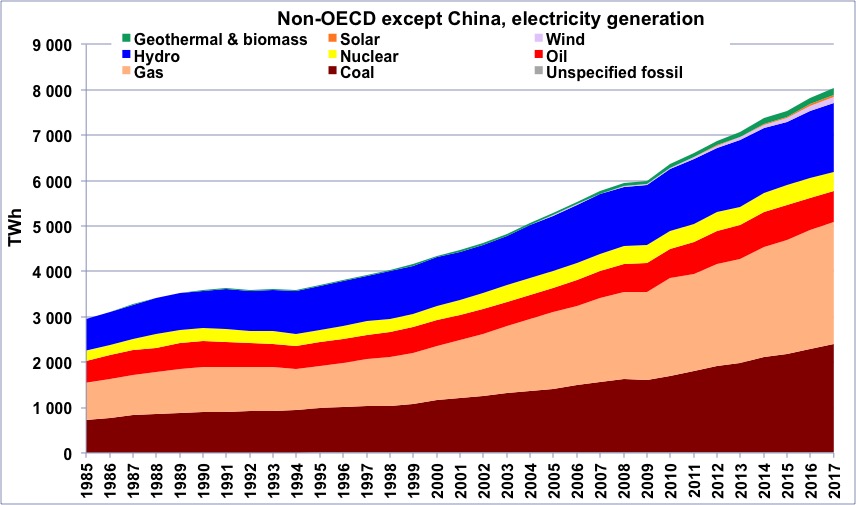
Electricity generation in Non OECD except China from 1985, in billion kWh.
Most of the recent increase is due to fossil fuels, alas…
Source: BP Statistical Review
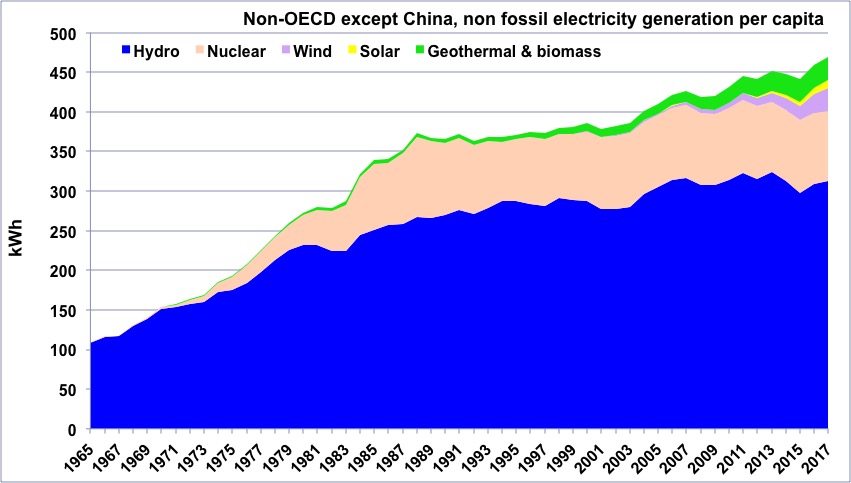
“Non fossil” electricity generation per capita in China since 1965.
This “non fossil” fraction represents about 30% of the total in the zone.
Author’s compilation on data from BP Statistical Review
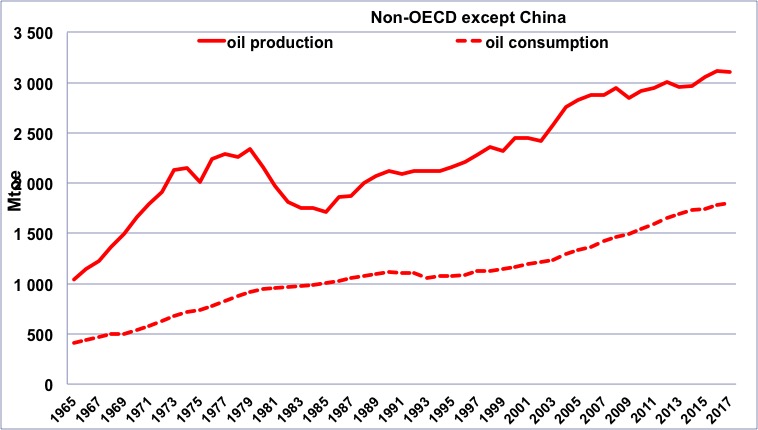
Oil production (solid line) and consumption (dotted line) in the non OECD except China zone since 1965, in million tonnes.
The zone is a global exporter, which is not a major surprise since it includes many zones that are net exporters taken one by one: the Middle East, Russia, Africa, and Latin America
Author’s compilation on data from BP Statistical Review
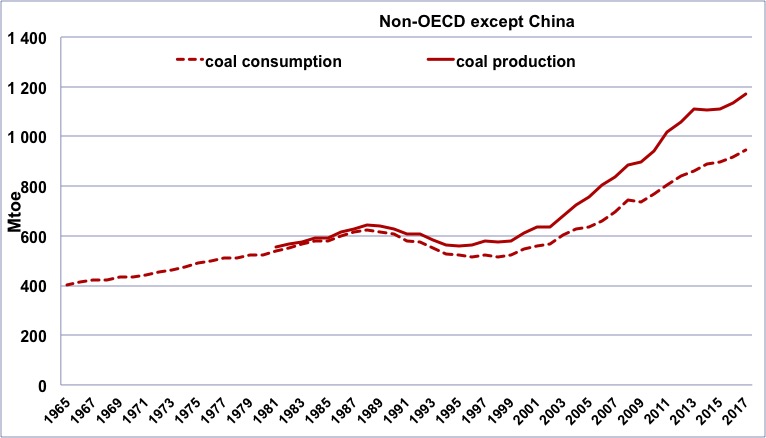
Coal production (solid line) and consumption (dotted line) in the non OECD except China zone since 1965, in million tonnes oil equivalent (1 tonne oil equivalent of coal ≈ 1,5 to 3 tonnes of coal, depending on its quality).
The zone is a small global exporter.
Author’s compilation on data from BP Statistical Review
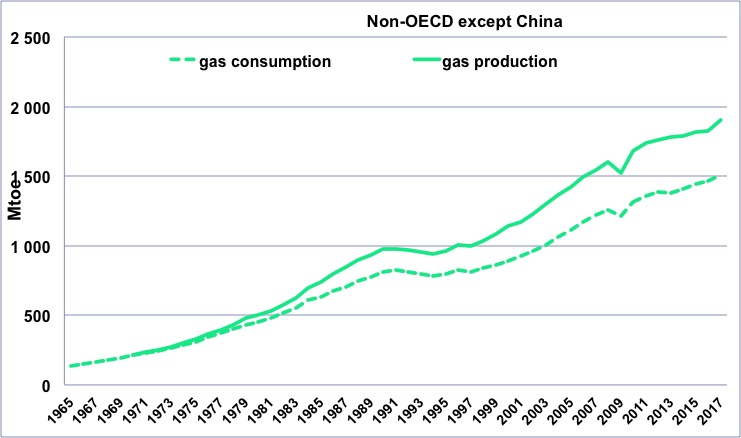
Gas production (solid line, since 1970) and consumption (dotted line, since 1965) in the non OECD except China zone, in million tonnes oil equivalent (1 tonne oil equivalent of gas ≈ 1000 m3).
The zone is a global exporter, which is not a major surprise since it includes many zones that are net exporters taken one by one: the Middle East, Russia, and Africa.
Author’s compilation on data from BP Statistical Review