Paris urbanization from 1800 to 2000
Source : NYU Stern urbanization
From the figures describing land use in France, I calculated the total surface covered by buildings, roads, and artificial surfaces not built (typically gardens). I also calculated the rate of increase of these various surfaces (below, surfaces are in square km).
| Land use | 1992 | % of Total | 2000 | % of Total | Change from 1992 to 2000 (km²) | Change from 1992 to 2000 (%) | Change by year |
|---|---|---|---|---|---|---|---|
| Artificialized land not built | 13 236 km² | 2,42% | 15 580 km² | 2,84% | 2 344 km² | 17,7% | 2,1% |
| Built land | 9 424 km² | 1,72% | 10 590 km² | 1,93% | 1 166 km² | 12,4% | 1,5% |
| Roads & parking lots | 15 354 km² | 2,80% | 16 830 km² | 3,07% | 1 476 km² | 9,6% | 1,2% |
| Forests | 144 221 km² | 26,32% | 150 940 km² | 27,46% | 6 269 km² | 4,3% | 0,53% |
| Annual cultures | 151 558 km² | 27,66% | 152 990 km² | 27,92% | 1 432 km² | 0,94% | 0,12% |
| Rocks & water | 18 373 km² | 3,35% | 18 250 km² | 3,33% | -123 km² | -0,67% | -0,08% |
| Permanent cultures (fruit trees...) | 13 193 km² | 2,41% | 12 830 km² | 2,34% | -363 km² | -2,8% | -0,35% |
| Grasslands | 116 888 km² | 21,33% | 109 800 km² | 20,04% | -7 088 km² | -6,1% | -0,78% |
| Mountain pastures | 45 038 km² | 8,22% | 41 710 km² | 7,61% | -3 328 km² | -7,4% | -0,95% |
| Scattered trees | 20 669 km² | 3,77% | 18 870 km² | 3,44% | -1 799 km² | -8,7% | -1,1% |
| TOTAL | 547 954 km² | 100%n | 547 940 km² | 100% | - | - | - |
| Of which TOTAL artificialized | 38 014 km² | 6,94% | 43 000 km² | 7,85% | - | 13,12% | 1,55% |
Source: IFEN
All this fits what we know : urbanized land and forests grow, while grasslands decrease. One of the driving forces of this evolution is something called peri-urbanization, which designates the process by which cities grow by increasing their suburbs.

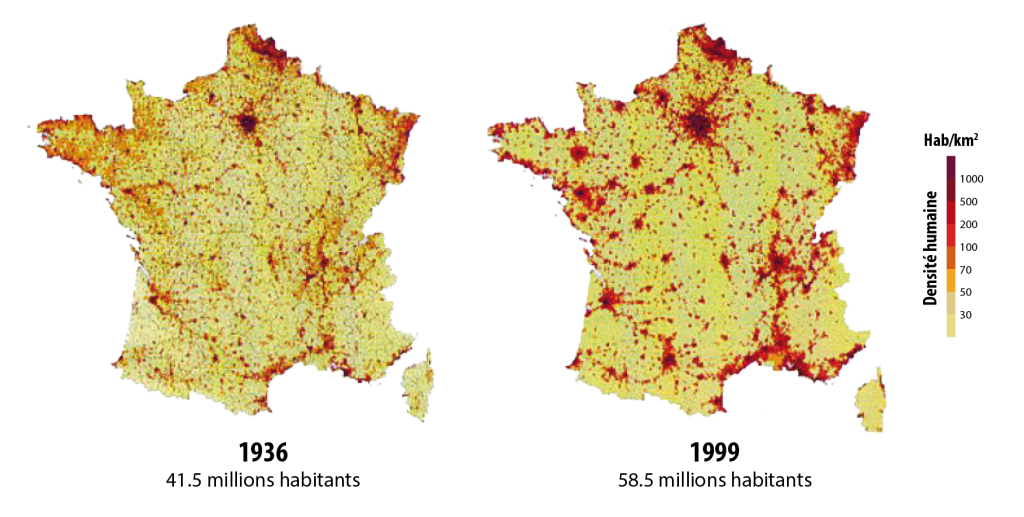
Urbanization evolution in France in 1936 (41,5 millions inhabitants) and in 1999 (58,5 millions inhabitants).
The french population increased by 40% betweeb 1936 and 1999.
Some urban areas have grown tenfold, while rural areas emptied.
Source : DATAR.
Some urban areas have grown tenfold, while rural areas emptied.

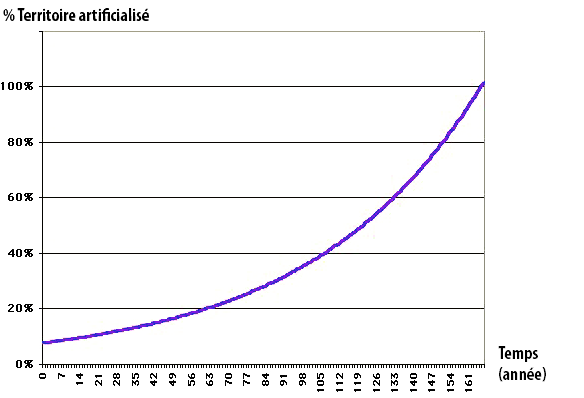
Fraction of the mainland urbanized depending on the number of years after 1998.
We see above that a prolongation of the present growth rate means that mainland France has been turned to a single city in 160 years.
If we assume that we cannot do without a fat 50% for agriculture and forests, then it just takes a century to urbanize the remaining 50%.
Is it legitimate to assume a growth constant in percentage and not in absolute figures ? (which would mean so many hectares per year). We must remember that a growth expressed in percentage corresponds to the case when the yearly increase is proportional to the existing value. If the increase results from peri-urbanization, assuming that the increase (at the border of the cities) is proportionnal to the size of the city is not totally stupid.
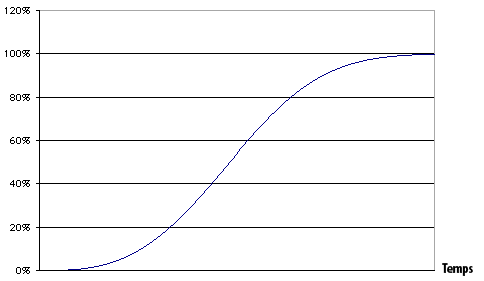
Still, the above calculation has no predictive value, of course ! In particular, when there is an upper limit to something (which is the case here : it is not possible to go over 100% of the mainland !), the general evolution never resembles the above curve, but has rather a “S-shaped” aspect, like the curve below.

General aspect of processes starting from zero and limited by an upper value (the horizontal axis represents time).
This being said, this little calcculation gives a rough idea of the speed at which we are currently modifying land use in France, and underlines the fact that this is absolutely not “sustainable”. To be “sustainable” an evolution must not meet its limit before a century !
Let’s recall that land is a limited (and not renewable !) resource, even if we can change land-use.