That’s an easy go: energy is the amount of (on) my electricity bill, or maybe of (on) my natural gas bill. If I am very concentrated, I might add that it is also the money I spend at the gasoline pump, and if I am even more concentrated I will suggest that it might have something to do with the filling up of my domestic fuel oil tank. Next question?
The economist might add that energy represents 7% of the spendings of households in France (in other OECD countries the percentage is probably close), and therefore that if the price of electricity increases it is annoying because it hurts a little the purchasing power, but nobody should die from it.
But, with such an approach, that is bringing everything back to money, we will miss the biggest part, because in industrialized countries energy plays a physical role far more important than its share in our spendings. Physical, is that connected in any way with physics? Indeed, before being an amount on a bill, energy has a definition in physics: it is the notion that characterizes a change of state in a system. Woaw! This seems awfully complicated! Actually, it’s very simple: it just says that as soon as the world that surrounds us (= “a system”) changes, energy plays a role, and the amount of energy invoplved measures the magnitude of the changeof the system between before and after.
If we look around us, we will witness that, indeed, as soon as “something happens”, there is energy playing a role:
- A change of temperature uses or yields energy. It’s this energy that we use to heat or cool a room, food, water for a shower (actually we seldom cool that one!), etc. All industrial machines that cook, sterilize, heat, cool or freeze therefore need – or use – energy,
- A change of state of matter (going from solid to liquid, or liquid to gaseous), what physicists call a change of phase, uses or yields energy, called latent heat. Our body uses that energy to cool down when it’s too hot: its perspiration, which basically consists in evaporating water coming from our serum (which is why it makes the skin salted). Cooling machines (fridges, freezers), and machines that use the reverse process (heat pumps) use the latent heat of evaporation or condensation to transfer heat. All industrial processes that melt (about any process of production of raw materials melts something at some time) or evaporate use that kind of energy.
- A change of speed of an object uses or yields energy. Putting cars, trucks, trains, planes and boats in motion uses about 20% or the overall energy consumption of the world,
- A change of chemical composition uses or yields energy. A combustion, for example, is a chemical transformation that yields energy, through associating oxygen to the atoms of the initial coumpound, and symetrically reduction (the fact of removing oxygen from a molecule that has some, for example a metal oxide) requires energy. 10 to 15% of the world energy consumption is used to modify a chemical composition. 7% to 8% is used in chemical industries, that transform various natural resources (air, water, minerals, oil products, etc) into other molécules (hundreds of thousands!). 5% is used to reduce metal oxides, first of all iron oxides, to produce metals.
- Creating or absorbing electromagnetic radiation is also a process involving energy. For example, the energy released by fusing nucleus in the Sun is transformed into radiation, that carries energy to the Earth, where it is absorbed and heats the surface and the atmosphere (and puts in motion the climate system and plant growth). Almost 100% of renewable energy we can access (except geothermal energy) is therefore coming from radiation transformation (and even oil, coal and gas are remote remains of past radiation!). It is also energy enclosed in radiation that carries the information allowing the radio, the TV, cellular phones and wifi device to operate, even if the amounts of energy associated are not considerable. The laser that cuts tissues in a cloth plant uses that energy also!
- Changing a shape involves energy. A stamp mill and a potato peeler both change a shape (crushing ore in the first case and separatig a potato from its peel in the second), and energy is required in both cases (our arm is enough in the second case!). All industrial machines (or sometimes domestic ones) that crush, expand, add or remove matter, flatten, elongate, saw, cut, and modifiy the shape in whatever other way therefore require energy,
- Moving a mass in a gravitational field involves energy. When the gravitational field is that of the Earth, we are talking about weight. It is against that energy that we are struggling during a mountain hike, and it is that energy that pulls us down when we ride a bike down the slope. Each time we use the weight of an object, it is actually gravitational energy that we use. And there are a number of devices that use weights, from lifts to cranes.
- Any interaction between an electric current and a magnetic field involves energy. When a current in brought inside a magnetic field to get some motion, we are talking of an electric engine, which is now found everywhere around us, from water supply to sewers, from computer hard drives to freezers, from trains to vacuum cleaners, from industrial lines to gasoline pumps, from compressors to automatic doors, and from cable-cars to air-con… When it is motion that is brought to get some electricity out, it is an alternator, that can be found in any car and any power plant!
- Changing an atom’s nucleus involves energy: it is nuclear energy. It is associated to radioactivity, fusion and fission. As nuclear energy is extremely intense (there is a much energy released by the fission of one gram of uranimum than by the burning of a ton of oil), men have limited its domestication to about three cases: electricity generation, bombs (alas), and radiotherapy (cobalt 60, a radioactive source, is used to irradiate tumor cells).
Again, nothing can happen in the physical world without energy interveining. The larger the change, and the more, by definition, energy is involved. As a logical consequence, if we carefully look at the way occidentals increased their material consumption, we will find energy everywhere:
humanity has used more and more energy to extract (mechanical energy), transform (chemical energy), work on (mechanical energy), and displace (kinetic energy) mineral or biological resources that compose the innumerable amount of objects we now have at our disposal, including large objects such as buildings, cars and trains, plants, infrastructure, etc
we have used more and more energy to put in motion machines that transport goods or… ourselves (automobiles, trucks, trains, planes, boats),
we have used more and more energy to heat or cool spaces that we have separated from the “outside world”, that is buildings of all kind
It is therefore logical that the average consumption per capita has strongly risen during the course of industrialization
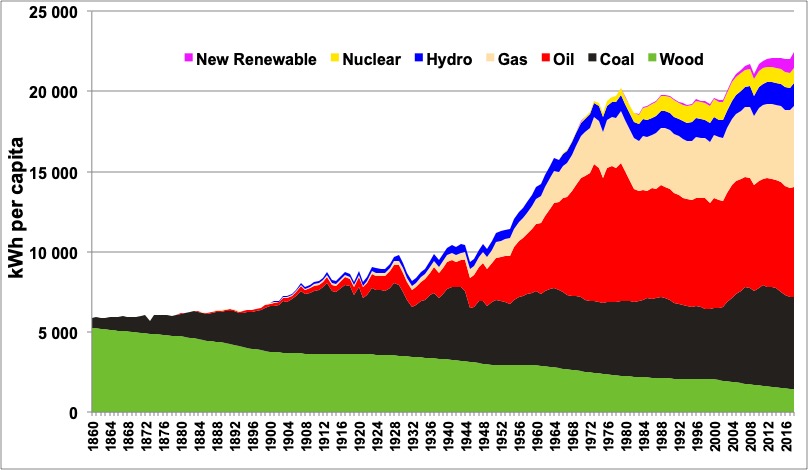
Evolution of the average energy consumption per capita in the world, since 1880, wood included (estimated).
The vertical axis is graduated in kWh (1 kWh = 0,003 MBTU).
An inhabitant of the planet therefore uses, on average, a little more than 20.000 kWh per year.
The above diagram clearly outlines three distinctive periods since the beginning of the industrial revolution: for more than a century (1860 to 1979) the amount ef energy per capita has been rising strongly, and after the second oil shock in 1979 it remained almost constant until the beginning of the 2000 decade. There has been again a rise during the 2000’s, corresponding to a strong growth in the emerging countries fueled by coal, mostly China, where it is the first energy used.
Author’s compilation of the following primary sources: Shilling et al., BP statistical review, Energy Information Agency, United Nations.
Because of what is exposed above, it is easy to understand that our productive system – and therefore the economy – depends strongly on energy. Our economy is “only” a large system to transform resources, taking into the environment all kind of things to turn them into products and services. As any transformation goes along with the use of energy, it seems logical that the output of the economy is strongly coupled to the amount of energy injected in the system. This energy can either come from our muscles, or from machines.
But a quick calculation shows that, using its arms and legs, a human organism can yield at most 150 kWh of mechanical output per year. What the above graph says, therefore, is that oil, gas and coal have enabled men to multiply by several hundreds their physical action on the environment. In Europe, where the energy consumption is rather around 60.000 kWh per person and per year (including the energy used to manufacture imported goods), the multiple is more something like 500.
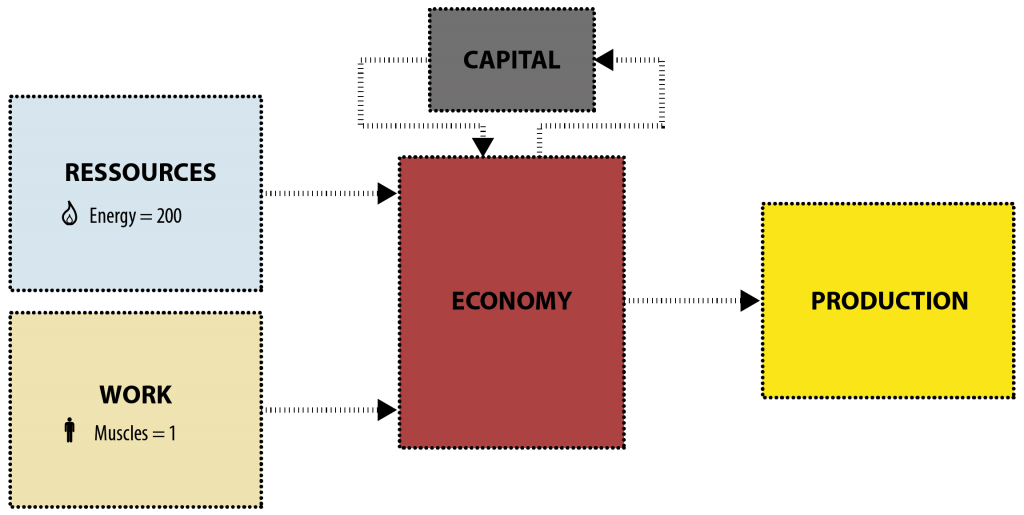
Simplified representation of the physical flows that sustain our productive system, which is nothing else than a tremendous organization to transform natural resources (that are free in conventional economics, and therefore can never lack), with work (thus energy).
Work – a from of energy – comes, from a marginal fraction, from our muscles (that use the energy of food), and for the most from machines, that “eat”‘ energy (oil products, electricity and therefore coal and gas, etc). On average, the energy coming from machines is worth 200 times that coming from our muscles, and it amounts to 500 times for an European (and almost 1000 times for an American).
“Productivity of work” is therefore a direct function of the number and size of machines we have per capita….
Capital formation is an internal loop of the system: it is formed with past resources and work (I did not invent anything, it is exactely how it was dealt with in the work of Meadows et al.).
One easily understands, then, that if we have plenty of workers and plenty of capital, but no energy (examples: a caterpillar with no oil, a plant with no electricity), we won’t get any significant production!
In other words, what creates the industrial output in the world is first of all the energy we use, far ahead the work of people. As the tertiary sector depends on the industrial output, and does not exist independently, it means that energy is the true engine of the industrial civilisation, office work included. Our arms and legs are only there to manipulate switches and valves, that unleash the power of energy!
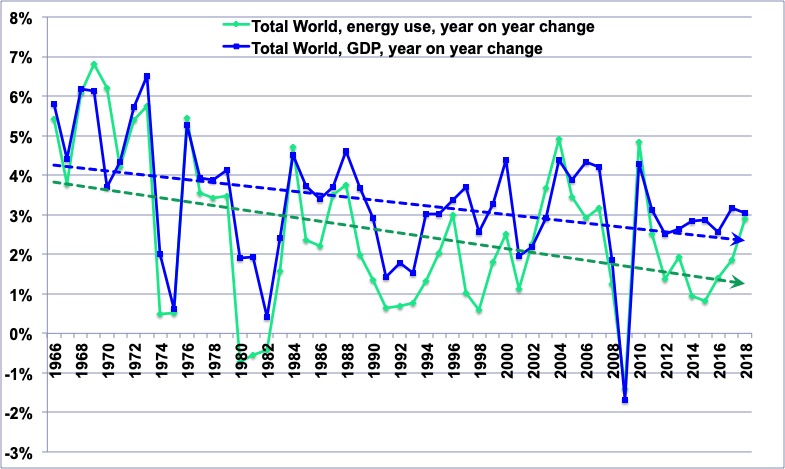
Respective year on year changes, since 1965, of the world GDP (blue curve), and the world energy consumption, excluding wood (green curve).
It is easy to see that the two evolve almost the same way. Besides in 1980, 1989, 1997, and 2005, the drop in energy supply preceded the drop of the GDP, that came shortly after.
Author’s calculation on primary information coming from BP Statistical Review, 2015, and World Bank 2015 (GDP).
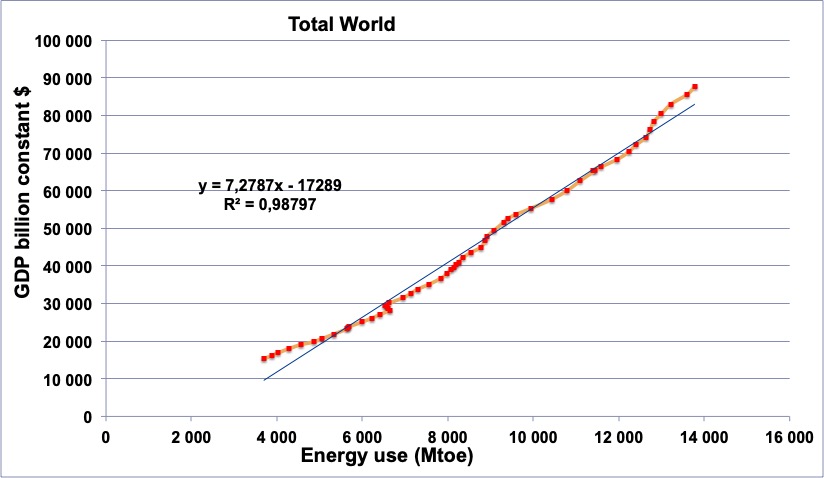
World GDP in constant dollars (vertical axis) plotted against the world energy consumption in million tonnes oil equivalent (horizontal axis), from 1965 to 2014.
The correlation between the two variables is clear.
Author’s calculation on primary information coming from BP Statistical Review, 2015, and World Bank 2015 (GDP).
One should note that if we try to correlate the world GDP to oil price, than we get no clear pattern.
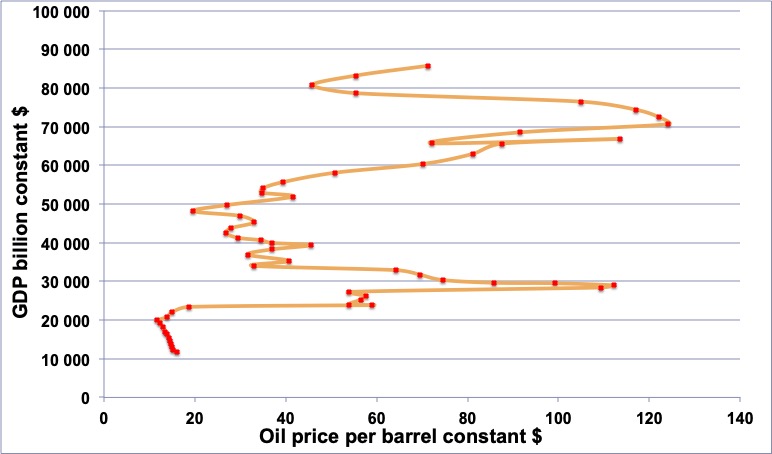
World GDP in constant dollars (vertical axis) plotted against the price per barrel of oil in constant dollars (horizontal axis), from 1960 to 2014.
There is no obvious correlation: the GDP can increase with a decreasing oil price, but also with a rising oil price, and from 2008 to 2009 we also had a decreasing GDP with a decreasing price.
Let’s recall that the world trade in general, and that of oil in particular, is a balanced system: when the importer pays more, the exporter earns more, and the net effect on the world GDP is nil.
Author’s calculation on primary information coming from BP statistical review & Energy Information Agency (energy) and World Bank (GDP).
What counts for the world economy is actually not the price of oil, but the volume of oil produced. Anyone will then say that if there is less oil the price will increase, and vice versa, but it happens that there is no such long term relation if we look at past statistics…
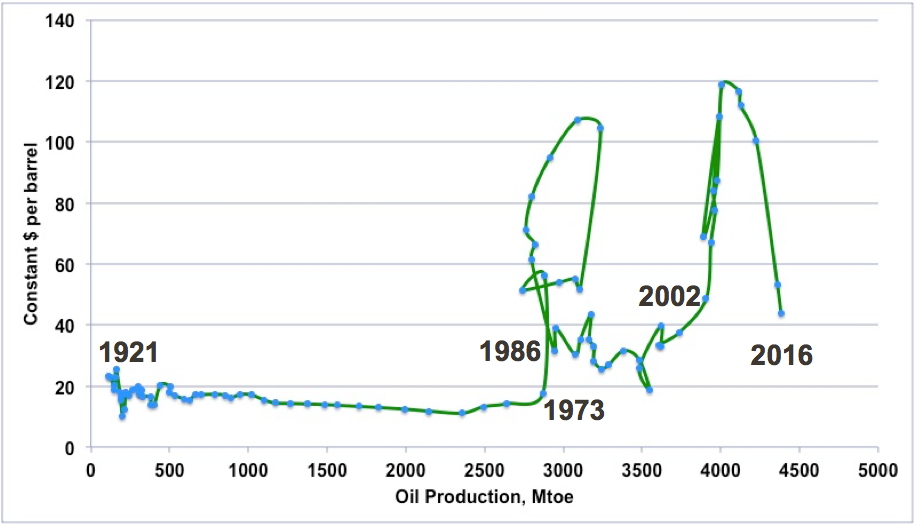
World oil consumption (horizontal axis) plotted against the price per barrel of oil in constant dollars, from 1921 to 2014.
There is no such thing as an elasticity between price and volume. Actually, there rather seems to be only two stable regimes: a constant or almost constant price with a highly variable consumption (1921 to 1973 and 1986 to 2001), or an almost constant consumption with a highly variable price (1973 to 1986 and 2002 to 2014).
Author’s calculation on primary information coming from BP statistical review & Shillig et al.
On the opposite, there is a very strong link between oil in volume and the world GDP. A simple explanation can be put forward: oil is king in transportation, and transportation is indispensable to any economic activity.
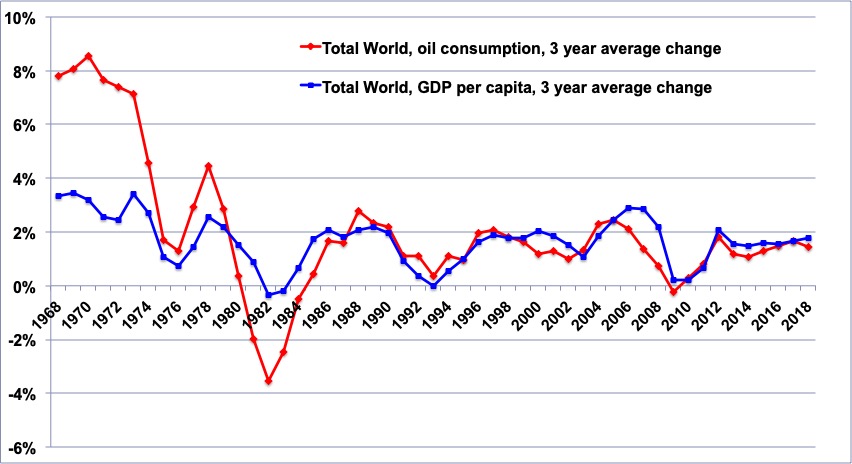
The red curve gives a 3 year running mean for the variation of the volume of oil produced worldwide.
The blue one gives the 3 year running mean for the variation of the world average of the GDP per capita.
It is easy to see that the two curves behave about the same way after 1986, with the change on the GDP per capita following the change on oil production and not the opposite. It is also easy to seen that before 1986 the magnitude of the variation was greater for oil production than for GDP per capita, when after they became of the same magnitude.
This suggest that the dependancy of our economic system on oil has increased and not decreased, which is consistent with the development of globalization, that heavily relies on international transportation.
Sources: BP Statistical Review (volume of oil) and World Bank (average GDP)
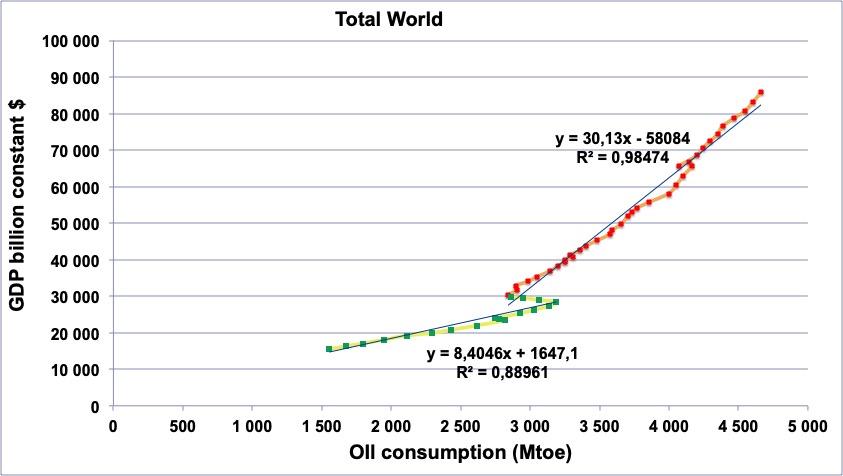
GDP per capita – world average – in constant 2012 dollars (vertical axis) plotted against the world oil consumption in million tonnes oil equivalent (horizontal axis), from 1965 to 2014.
Green: data from 1965 to 1982,
Red: data from 1983 to 2014.
The correlation is better for recent years, which shows that the world economy is not less dependent on oil: the dependency has increased, even though we get “more GDP per barrel” today than before.
Author’s calculation on primary information coming from BP statistical review & Shilling et al. (energy) and World Bank (GDP).
This obviously brings in a question: what is the economy going to become with less oil?
Can I use more and more energy?
All that has been stated above is indeed absolutely fascinating, and even breathtaking, but if energy is available without any limit, it will mainly be useful for desperate attemps to draw attention during a diner with friends. The economy relies on energy, so be it, and all we have to do is use more and more energy to have more and more economy, and that will settle any issue with pension funds and the popularity of prime ministers.
But… energy has a major characteristic, well known by physicists: in a closed system, it can neither be created, nor be destroyed, but only be transformed. The energy used by a system has thus to come from outside the system, because it is absolutely forbidden that “more energy” appears spontaneously in this system. An engine does not “create” mechanical energy, it transforms in mechanical energy (and in heat) a previously existing chemical energy (that of the fuel) that comes from the outside. In the same respect, gasoline did not spontaneously appear in the ground, but comes from the conversion of old solar energy.
Incidentally, the expression “energy producer” should not be used to mention the operator of a power plant, or sometimes an oil producer. The proper expression should be “energy transformer” for a power plant, and “energy miner” for an oil company, because no human activity can create an energy that did not previously exist! Incidentally, when anyone claims to have discovered a machine that yields more energy than it receives from the environment, it is a variation of perpetual move: impossible! Even the heat pump, that seems to perform this apparent miracle, as the heat it yields represents more energy than the electricity used, actually gives back the energy it receives from the grid (electricity) and from the outside (calories).
What changes, each time energy is used, is the “grade” of this energy, characterized by a notion which is called entropy, which measures the “degree of disorder” of the energy. Each transformation increases the entropy. Mechanical energy has the lowest entropy, low temperature heat the highest. This is why any use of energy ends with low temperature heat.
As physics forbid to create energy, humanity will never be able to do anything else than taking advantage of energies that already exists in the environment: matter able to burn (wood and biomass, fossil fuels), fissile nucleus (uranium), existing radiation (Sun), existing movement (waterfalls, wind, tides), etc. And, of course, we are limited to consuming no more energy than the amounts available in the environment. Any energy that does not exist in the environment (electricity, hydrogen…) it cannot be considered as an energy source: it is just a way to use an energy that has to be drawn from the environment in the first place.
A second limitation is often a major one: that of available power. Our industrial uses not only need a lot of energy, but they need even more a lot of power, that is the delivery of energy over a very short period of time. A car weighting one ton that travels at 100 km/h represents a kinetic energy of about 0,1 kWh. It is not tremendous: a man that cycles like mad can yield that energy in a couple hours. But what we want is our car to get to its cruising speed in a matter of tens of seconds, not in a few hours! It’s another way to say that the energy sources that are of some interest, for our “modern uses”, are those able to yield a lot of power.
And the whole debate on renewables is there, because the Sun can very well send us each hour the energy that we use in a year, this energy is scattered on the full surface of the Earth, with a low power per surface unit. Getting that energy “concentrated” to bring it to the level of fossil fuels will often be the difficult part.
And then?
Now that the physical flows that generate the economic output are put in motion by an energy hundreds of times more powerful than that of our muscles, a reasonable hypothesis is to consider that our economy will not be able to grow faster than the energy supply, with a little “relief” granted by energy efficiency, but that is far from being massive when examined for previous decades. It is pretty coherent with the fact that the evolution of oil production, that dominates by far the energy supply (oil represents 42% of the final energy consumption in the world), is the best indicator of the future evolution of the GDP.
If we go back to the graph above that gives the average energy consumption per capita, we see that there have been two very different stages since the beginning of “industry for everyone”:
- until the two oil shocks, the supply per capita is following a steady growth of 2,5% per year on average,
- since 1980, and even with the growth of the last 10 years, the increase is only 0,4% per year on average.
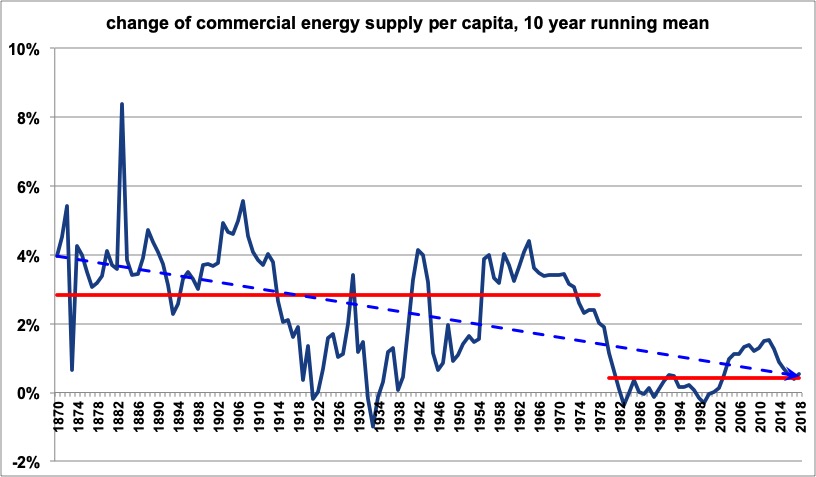
Annual variation of the average energy consumption per capita in the world since 1860.
The blue curve gives the annual change; the horizontal red line on the left gives the mean for the 1860-1980 period,
The horizontal red line on the right gives the mean for the 1981-2014 period.
It is easy to see that the two oil shocks correspond to a sharp drop in the average rate of increase of the energy consumption per capita: before it was 2,4% per year on average, after it fell to 0,4% per year on average.
Author’s calculations on primary data from Shilling et al., BP statistical review & Energy Information Agency (energy) and United Nations (Population).
It happens that the economic evolution of the 20th century (and the early 21st) also comprises two very different episodes:
- from 1880 to 1975, when energy per capita is strongly growing, the world undergoes just one major economic crisis, in 1929.
- since 1975, after the rate of growth dramatically decreased, there has been a crisis every 5 to 10 years: 1975, 1980, 1991, 2000, 2008, 2012, and it would be no surprise to have a new one in the coming years.
As the role of energy is to help transforming things, all this is logical: less energy = a lower transformation capacity = less GDP that only measures the amount of transformation. We can even go further in this direction with the simple maths that follows, and we will begin with an equation than anyone should agree on, which is that the world GDP is equal to itself (!).
GDP= GDP
So far, we should all agree! Then we will multiply and divide, on the right hand side, by the world energy consumption, called NRJ.
GDP= \frac{GDP} {NRJ}\times{NRJ}
We have just written that:
\text{\scriptsize{World GDP}}=\text{ \scriptsize{GDP per energy unit} }\times \text{ \scriptsize{Energy consumption}}
The term “GDP per energy unit” is nothing else than the energy efficiency of the economy: the more efficient the economic system is, the more GDP is produced with the same amount of energy. In other words, when this term increases, it means that for the same amount of kWh (or BTU!), we can have more furniture, glasses, cars, frozen peas, buildings or coffee machines.
We will then bring that equality to amounts per capita, by dividing on both sides by the world population, named POP:
\frac{GDP} {Pop}= \frac{GDP} {NRJ}\times \frac{NRJ} {Pop}
We have now written that:
\text{\scriptsize{GDP per capita (world average)}}=\text{ \scriptsize{GDP per energy unit} }\times \text{ \scriptsize{Energy consumption per capita}}
We will now shift from the terms to their increase or decrease over time. Indeed, when two terms are equal, then their variation over time is also equal! And in doing so we will benefit from a little help from maths: when each of the righ hand side terms varies slowly over time, the variation of their product is equal – on the first order – to the sum of their variations.
In other words, il we have A = B*C, then the change of A year on year, noted %A, is basically equal to %B+%C, for %B and %C that remain “small” (several % per year is OK on that respect). If the world population increases by 2% per year and the energy consumption per capita increases by 4% per year, the global energy consumption (which is the multiplication of the 2 previous terms) increases by 6% per year (4%+2%) and not 4%*2%!
With this information we can then write:
\%\frac{GDP} {Pop}= \% \frac{GDP} {NRJ} \times \% \frac{NRJ} {Pop}
The left term is nothing else than… “growth per capita”.
This equation therefore means that:
\text{\scriptsize{Growth of GDP per capita}}=\text{ \scriptsize{Growth of GDP per energy unit} }\times \text{ \scriptsize{Growth of energy consumption per capita}}
Then the first graph on this page shows that the term NRJ/POP abruptely shifted from a 2% yearly growth – that had been sustained for more than a century – to… zero. Meanwhile the term GDP/NRJ went on growing by a little less than 1% per year since 1970, and this rythm has not been modified much by the oil shocks.
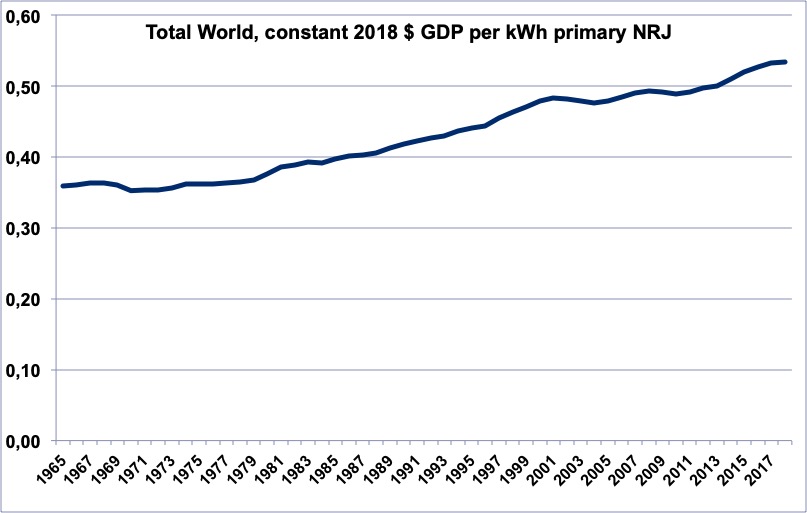
Constant dollars of GDP produced per kWh of primary energy consumed, since 1965. What this curve shows is that to get a dollar of GDP in 2014 in the world, it requires 30% less energy than in 1965.
The term GDP/NRJ therefore gained a little less than 1% per year since 1965 (0,8% per year to be precise!), but we notice that for the last decade it has been flat.
Source: BP Statistical Review 2015 for energy, World Bank 2015 for GDP.
In the past, this simple equation explains why the GDP per capita, in world average, abruptely went from a growth of 3% per year before 1980 (a little less than 1% per year for GDP/NRJ + 2% per year for NRJ/POP) to a little above 1% per year right after 1980 (still a little less than 1% per year for GDP/NRJ but 0,4% per year for NRJ/POP). All the rest (growing debt, unemployement impossible to get rid of, repetitive speculative bubbles) can quite logically be linked to this abrupt change.
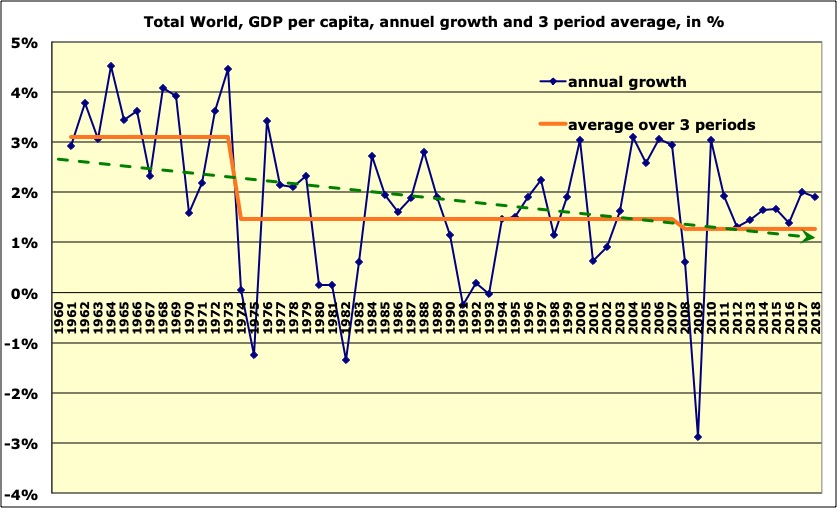
Evolution of the GDP per capita since 1960 (blue line), and average per decade (red line).
The decrease after the first oil shock is clearly visible, as is the fact that since 1980 the increase is a little above 1% per year. When the energy per capita is going to decrease significantly (that will happen sooner or later), the GDP per capita is probably going to decrease accordingly.
Source: World Bank 2015 for the primary data, average calculated by the author
And what for the future ? If the future is strongly constrained on energy, and it will, particularly on oil and gas, then the term NRJ/POP will become negative, and recurring recessions will become something normal in our economic system. This is fully consistent with the physical reality: less energy = less transformation capacity = less GDP that only measures a transformation.
Decoupling energy and the GDP is much faster said than done…