As a result of the dilatation of water under the effect of heat (warm water occupies a little more space than cold water) and of the ice melting (under the effect of heat also), it is a certitude that the sea level will rise. The only question is to know by how much, how long after temperatures stabilize, and what will be the geographical pattern, because this rise won’t be homogeneous at all !
A first cause of sea level rise – dilatation of water under the effect of heat – is the easiest to predict as a result of the mean surface temperature increase. Indeed, the surface ocean (let’s say the first 100 meters below the surface) will globally warm up a little, and thus dilate. As an ocean is nothing else than a big bathtub, if the water dilates, the sea level rises. Stated this way, the process seems simple, but actually it is not that simple.
First of all, tectonics slowly change the form of the “bathtub”. If the result is to increase the size of the bathtub, then the sea level rise might be locally smaller, but if the bathtub “shrinks” at the same time, then the two processes add up (but can be both partially or totally “neutralized” by something else, like strong evaporation in a closed sea…).
A second process can influence the local sea level: coastal rise. It currently happens in Scandinavia, where the whole country keeps rising as a result of the melting of the gigantic ice cap that covered it 20.000 years ago : the weight of the ice cap was such that its melting generated a rebound upwards of the ground.
At last, an additional cause of heterogeneity is just that the surface warming won’t be homogeneous, and thus, “everything equal otherwise”, the resulting dilatation no more. In other terms the ocean level rise, globally valid, is not incompatible with a local stability or even lowering of the sea level, either in absolute figures or relatively to the coast, just as a local temperature decrease is not incompatible with global increase (of the mean). The future rise will depend on the place, and also on the delay that follows the air temperature rise, because for a long time the ocean will “catch up” with the atmospheric increase” even if the latter stops.
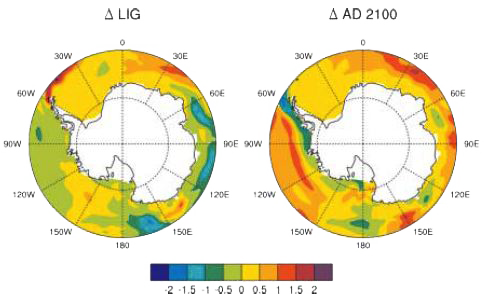
Temperature rise of the first 100 metres of the Antarctic Ocean in 2100 relatively to the present level (right), assuming 850 ppm of CO2 in 2100 (that is a tripling of the atmospheric CO2 compared to 1750).
It is easy to see that the rise is not homogeneous.
The left image represents the simulated temperature rise between today and the last interglacial maximum, 130.000 years ago, that was slightly warmer than today according to the above simulation.
Source : Overpeck et. al, Science, March 2006
A second contribution to the sea level rise will be the melting of any continental ice, that is any ice lying on firm ground (sea-ice, when melting, does not contribute to the sea level rise, no more than an ice cube melting in a glass raises the level of the glass: Archimede said so !). First source of concern: mid-latitude (and of course tropical) glaciers, since every zone will be concerned.
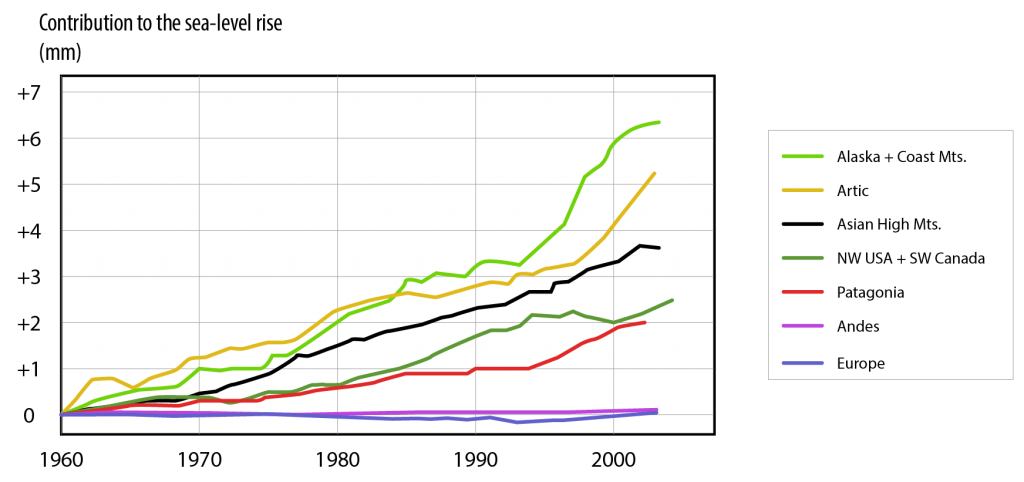
Cumulative contribution to the sea-level rise since 1960, expressed in mm (right axis), of continental glaciers and ice-caps, grouped by major zone.
For example, Alaska glaciers contributed – through their melting – to raise the average sea level by 6,5 mm since 1960.
Source : IPCC, 4th assessment report (working group 1), 2007
Of course, the major caps are at the Poles, but they will eventually be affected, because the temperature rise will be particularly high near the Poles.
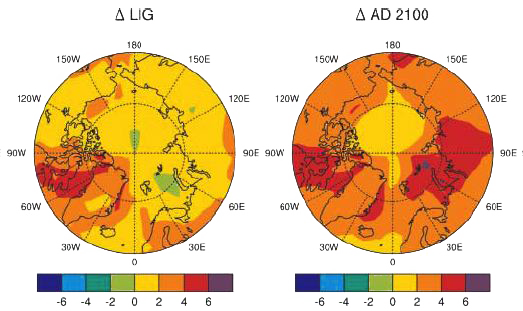
Right: near ground temperature increase of the air in 2100 – for Greenland – compared to today, assuming 850 ppm of CO2 in 2100 (that is three times more CO2 in 2100 than in 1800).
The left picture simulates the difference between today and the maximum average temperature experienced during the last interglacial, 130.000 years ago. The simulation suggests that it was a little hotter than today then, but significantly cooler than what could happen before 2100 with high greenhouse gases emissions.
This is an important result, because 130.000 years ago it seems that the sea level was 4 to 6 metres higher than today, partly because of a partial melt of the Greenland ice cap. If such a process happened with average temperature not as high as what we might experience before 2100, then it backs the idea that Greenland is about to melt at least partially as a result of our future emissions.
Source : Overpeck et. al, Science, March 2006

Reconstruction (through simulation) of the extent and height of the Greenland ice cap during the last interglacial maximum, 130.000 years ago..
If this reconstruction is accurate, it means that this ice cap was much smaller then, what triggered a 2 to 4 m increase of the global ocean sea level at the time.
Source : IPCC, 4th assessment report (working group 1), 2007
What the above simulation suggests is thus that Greenland could have significantly melt down in a couple centuries. Actually, Greenland could start to melt down soon, and when this process begins, it will be irreversible because of the positive feedbacks that will enhance the process, and will sooner or later lead to the melting of most of the ice cap. A 7 metre ocean level rise is at stake here.
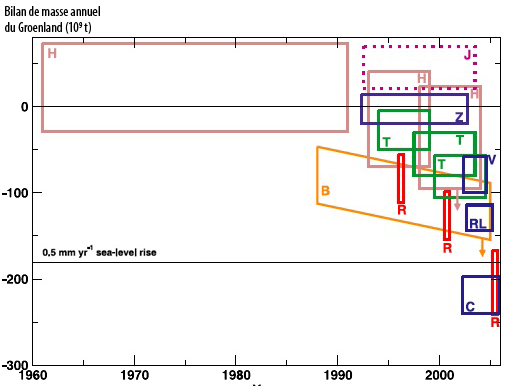
Various estimations of the annual mass balance of Greenland over recent periods, in billion tonnes of ice (lost or gained: positive is gained, negative lost) per year.
Each rectangle corresponds to a particular study. The horizontal side gives the period of the evaluation or the observations, the height is centered on the most probable value and gives the error range. The letter is used for the precise reference in the IPCC report (half a page for the full list !).
Available data strongly suggest a recent and spectacular increase in the loss of ice of this cap.
Source : 4th Assessment Report, IPCC, 2007
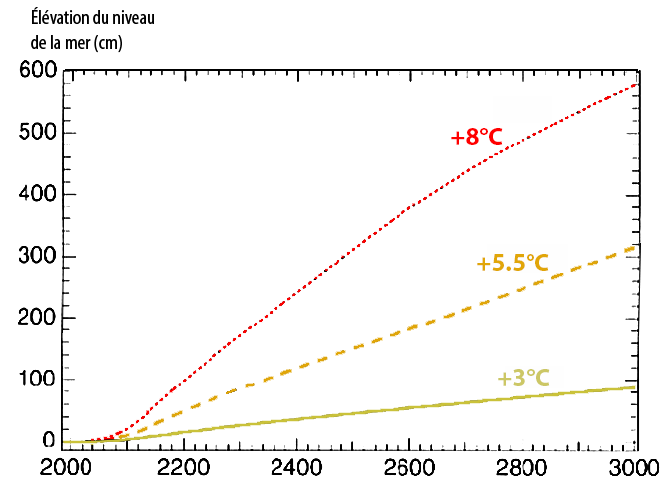
Predictions of the sea level rise between 2000 and 3000 depending on the ultimate temperature rise above Greenland.
If the temperature over Greenland eventually rises by 3 °C, the fraction of the ice cap that will melt will result in an increase of 1 meter of the sea level (worldwide, of course !). If the ultimate temperature rise over Greenland is over 8 °C, the whole ice cap might melt, resulting in a 6m surge of the oceans.
Given the fact that the temperature over Greenland will probably increase twice as fast as the planetary average, and that the eventual planetary temperature increase will probably be twice what it is in 2100, one can deduct that an 8 °C ultimate rise over Greenland might be reached with “just” 2° or 2,5°C of increase of the planetary average in 2100…and we have probably already committed ourselves for 1.5 °C at least….
Source : IPCC, 2001
Another ice cap that might not resist very well to the coming situation is the West Antarctic Ice Sheet, which is probably already undergoing the first effects of the warming in progress. A total meltdown of Antarctica would represent an extra 60 metres for the ocean level, but it is not on the agenda for the coming millenium.
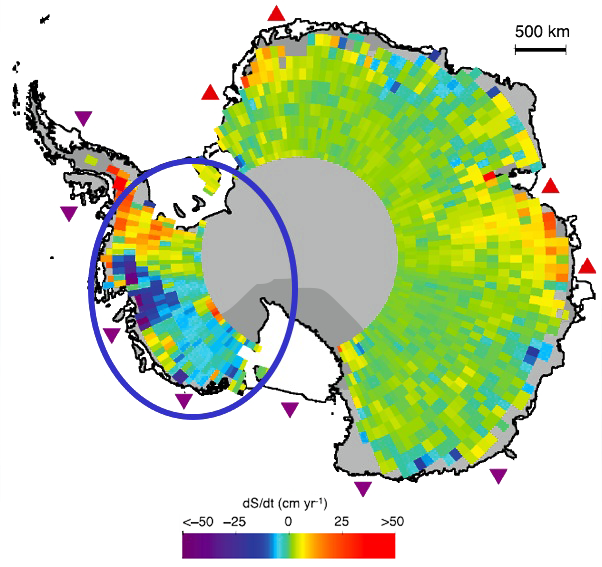
Average trend for the altitude change of the top of the ice cap (in cm per year), deducted from radar altimetry between 1992 and 2003 (this is the reason why there is no data close to the Pole: the satellite just doesn’t fly over there !).
In blue and violet, the altitude is decreasing (meaning a loww of mass) ; in green, yellow and red it’s the opposite (meaning a mass increase). Triangles near the coast represent the evolution of the thickness of the ice shelves : in red, major increase, in violet, major decrease.
The mass balance for the ice cap as a whole is not easy to establish, but the trend seems established for the West Antarctic Ice Sheet, ou WAIS. It’s the major source of concern for the future, and its melting down or disintegration would rise the ocean level by 6 metres.
Source : IPCC, 4th assessment report (working group 1), 2007
As for Greenland, it happens that Antarctica could also experience a temperature rise going over the world average, and way over what happened 130.000 years ago, during the last interglacial maximum.
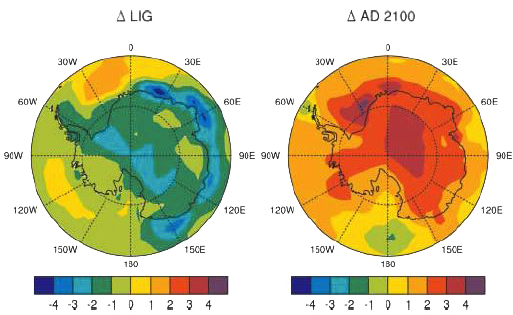
Right: near ground temperature increase of the air in 2100 – for Antarctica – compared to today, assuming 850 ppm of CO2 in 2100 (that is three times more CO2 in 2100 than in 1800).
The left picture simulates the difference between today and the maximum average temperature experienced during the last interglacial, 130.000 years ago.
The simulation suggests that it was a little colder than today over Antarctica then, thus indirectely suggesting that the Antarctica Ice Cap did not melt – even partially – then.
Source : Overpeck et. al, Science, March 2006
The combination of a warmer water, a higher sea level, a possible higher swell, and a warmer air mean that the ice shelves surroundng the cap might disintegrate, what will in turn make the West Antarctic Ice Sheet more vulnerable since it lies on an underwater bedrock.
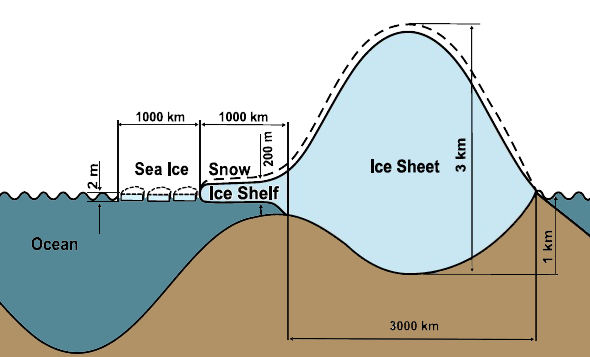
Schematic representation of the West Antarctic Ice Sheet.
Source : IPCC, 4th assessment report (working group 1), 2007
A combination of sea water dilatation and of a partial or total meltdown of Greenland and/or the West Antarctic would mean more than 10 metres extra for the ocean level at the millenium scale, but it is the high end of the bracket.
If we look a century ahead, then the increase of the sea level will be dominated by dilatation and the meltdown of mid-latitude glaciers, and the most probable evolutions would rather be measured in decimeters (see below).
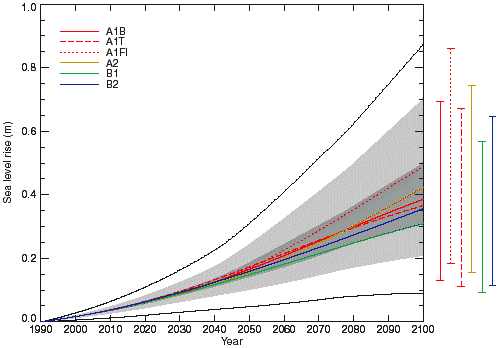
Predictions of the sea level rise between 1990 and 2100 depending on the emission scenarios and the models used. Each emission scenario (designated by an abreviation) has a different colour.
For a given colour, that is a given scenario, the bar on the right (of the same colour) gives the bracket of possible rises in 2100, depending on the models. For example the A1B scenario (plain red line), generates a rise of 13 to 70 cm depending on the model used. The B2 scenario, in green, leads to 10 to 57 cm depending on the models, etc. The curve of the corresponding colour represents the median evolution (that means “in the middle”) for the model ensemble.
The dark grey zone represents the enveloppe of the median evolutions, all scenarios taken into account, and the light grey zone shows the extra dispersion added by the fact that for a given scenario the various models yield different results.
Source : IPCC, 2001
A rise of that magnitude can definitely generate problems for coastal zones, near which 50% of humanity lives (to be precise, half the humanity lives within 50 km from the coast). We can fear the invasion by the sea of estuaries (biologically very rich and often cultivated), a significant increase of the risk of flooding during storms, etc.
Nevertheless, and without being excessively cynical, the damages associated to a moderate sea level rise are perhaps not to be feared as much as others consequences of climate change, because they will remain local and partly manageable : an invincible virus, a sudden semi-glacial climate in Europe, or the desertification of 3/4 of the planet are a risk for a large fraction of humanity, when a rise of a couple decimeters of the sea level might be locally very annoying (Dutch people will appreciate !) but not susceptible to endanger our whole species. In a century we would probably have more than enough time to build the necessary dams (even by hand, if oil has vanished then) or to displace a couple houses. The fact that some Pacific islands might be covered by water or that some Bengladesh farmers should move will certainly be a local catastrophe, but such events do not have the ability to lead to a global catastropha as some other risks have.
On the other hand, what is very annoying is that this process has a considerable inertia: at least several thousand years are needed before the ocean level stabilizes after temperatures have stabilized. In other terms, the sea level will continue to rise for the centuries to come, long after the temperatures have stabilized.
Sea life
Annoying consequences of climate change that apply to the ocean are not restricted to the average sea level: what happens inside the oceans might also be a source of trouble.
The current climatic evolution could first modify – or slow down, or halt – certain marine currents. Well these currents play an important role in the regional climates, and partly govern the life conditions in the open sea, so that their modification might have important consequences on life conditions ashore or in the sea.
Then the coral reefs, that are probably an important component of tropical coastal ecosystems, are very sensitive to modest temperature variations: a couple of extra degrees are generally fatal to these living being (they bleach then die in such cases). As the odds seem that we will have a hard time avoiding the planetary average to eventually increase by less than 1,5 to 2 °C, it is legitimate to ask whether a majority of corals are not condemned already at the horizon of one or two centuries.
It is difficult to figure what chain reactions could follow, because we rarely know the precise degree of interdependance of species, the most spectacular or visible not being necessarily the most “indispensable” for a given ecosystem (for example the mere vanishing of bees under our latitudes would probably be fatal to a large number of plants, as opposed to the probable vanishing of tigers that will be a sad and spectacular story (and unfortunetaly most probable), but will not endanger many other species. In the ocean, what do we know of the limits that key species might accept ? If life at large is not threatened, unpleasant surprises are not excluded…