If we refer to the dictionnary (not a bad book to read, sometimes…) a climate is defined by :
- insolation, that is the amount of solar energy received,
- temperature,
- pluviometry, and humidity of the layers of the atmosphere that are close to the ground,
- wind,
- atmospheric pressure at sea level,
- and even the electric field surrounding the atmosphere, air ionisation, and its chemical composition.
In addition, what defines a climate is both the limits within which the numerical values representing these various components may vary, but also the yearly mean of these values, the seasonal “sub-means”, and their variability. The latter reflects the frequency and/or the amplitude with which a given value moves apart from the mean value.

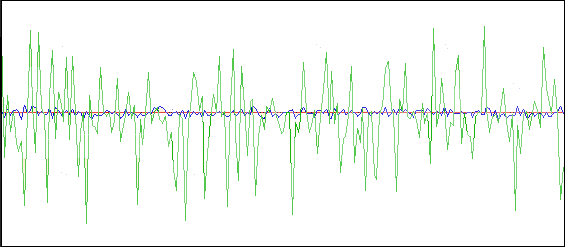
We have drawn above two curves – they don’t represent anything in particular – that have the same mean (in red) but a different variability : the green curve is much more variable, meaning that the instant value moves more frequently and/or more intenseley apart from the mean value.
So, an increase in variability, even with a mean value staying the same, might signify :
- a less regular pluviometry if it refers to precipitation, meaning more droughs and floodings,
- an increase of the heat and cold waves if it refers to temperatures,
- an increase in extremely windy episodes (storms, hurricanes, tornados, etc) if it refers to the wind…
Given all that characterizes a climate, a “climate change” therefore cannot be reduced a priori to a simple temperature change. It may – and will – also include a change in the mean value or the variability for precipitations, wind, soil moisture…
What do we know ?
There is today a consensus of the scientific community to consider that significantly increasing the greenhouse gas concentrations in the atmosphere will result in a climate change, for which two characteristics are now widely accepted :
- the mean near surface temperature will increase, the “only” (!) question that remains being to know by how much,
- the sea level will rise.
That explains why the most commonly quoted consequences of climate change are the two mentionned above : they are the most certain. But it does not mean that other parameters will not change (knowing what might change and what probably will not change is preciseley the job of many research workers). And, above all, there is one thing which is essential to keep in mind : ignorance is not a warranty. It is not because we don’t know of a possible consequence that it is impossible. On the opposite, a good way to summarize the evolution of the last 5 to 10 years regarding scientific knowledge could be : the more science progresses, and the more we discover that the climate system is not that stable, and so the more we can consider we are at risk by destabilizing it.
Mean values and variability
At last, when trying to assess the future, a conclusion on the evolution of the mean value is not enough. If we really want to know how bad (or good) climatic conditions could become, it is essentiaal to know how the variability will change. This general conclusion is illustrated below in the particular case of temperatures.

Increase in mean temperature.
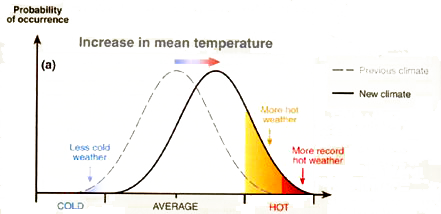
The dashed grey curve above represents the distribution of annual temperatures in the present climate (there is no scale, which is voluntary : the heigth and the width of the curve depend a lot on the type of climate).
On this kind of bell shaped curve, representig a distribution function, a high variability happens is represented by a very “flat” curve : there is then a higher probability that the temperature can venture far away from the average value.
The above graph represents the impact on the cold and hot extremes of a simple increase of the average temperature (that will happen in the future) “without touching” to the variability. There is a decrease of the number of cold days, the number of hot days increases, and there is the apparition of unprecedented very hot days

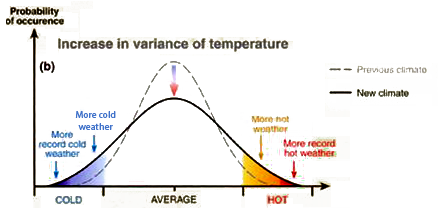
Increase in the variance of temperatures.
The above graph represents the consequences on the hot and cold extremes of “just” an increase of the variability, without any shift of the average value (what does not correspond to the ongoing evolution, since the average temperature is increasing, but it’s just to illustrate the isolated effect of an increase of the variability). We then get an increase of both the very hot and the very cold days, and the apparition of record temperatures on both ends of the scale.

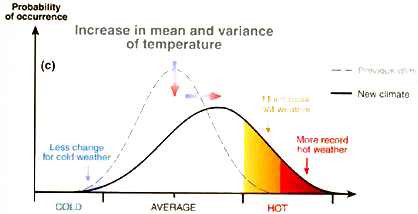
Increase in mean and variance of temperature.
The above graph illustrates the combined effect of an increase of the mean and of the variability. This leads to a decrease, but not to a vanishing, of the number or cold days, and a large increase of the number of very hot days, with the apparition of record temperatures unkonwn before.
Well, if the evolution of the mean values for the future climate has been (and still is) intensively assessed, there have not been so advanced comparative studies on the possible evolution of the variability. In other terms, scientists did not have the time and/or the possibility, so far, to cautiously compare what the various climate models indicate regarding the future variability of the climate, in addition to the fact that the limitations of the models are much stronger regarding variability than regarding mean values.
Such a work would mean comparing what various teams, working with different climate models, but with the same hypothesis regarding the future emissions, get regarding the number of very hot days, or very cold days, or very rainy days, etc. This explains why the conclusions of IPCC regarding extreme phenomena remain very cautious for the time being, and will probably remain so, for small scale processes, until they possibly happen. It does not signify, of course, that variability will not be modified in the future !