Greenhouse gases emissions, wealth, energy intensity, population… There would be a link between all those figures, that a number of experts – physicists, economists, engineers, demographs – all appreciate to discuss in their own field ? An simple equation, absolutely wonderful because it is precisely so simple (and, as we will see, so awful for the same reason), allows to show how these notions can be linked to one another, even though one might “not seen the point”. The rumor attributes the “discovery” of this equation to a japanese professor named Yoichi Kaya, hence the name (a sure thing is that this professor does exist and is a well known researcher in the energy policy sector).
All that follows derives from the simple fact – that generations of high school students surely remember ! – that it is always possible to multiply or divide both sides of an equation by the same number.
Our first equation couldn’t be more simple. Let’s call CO2 the world emissions of… CO2, the main greenhouse gas of human origin, and we can reasonnably assume that they are equal to themselves (!), so that we can write:
CO2= CO2
So far, everyone should follow ! Let’s now call TOE the world energy consumption (abreviation of Ton Oil Equivalent, of common use for energy people ; 1 TOE = 11600 kWh = 42 billion joules). We can at the same time multiply and divide one side by TOE, what leads to:
CO2= \frac{CO2} {TOE}\times{TOE}
What is the point ? It is that we just wrote:
\text{\scriptsize{CO2 emissions}}=\text{\scriptsize{Carbon content of energy} }\times \text{\scriptsize{Energy consumption}}
Indeed, the ratio (CO2/TOE) bears the name of “carbon content of energy”: it is the amount of CO2 that we must let go in the atmosphere to get a given amount of energy for our activities. This amount of CO2 is not the same whatever primary energy we use (primary energy is the one that we find “as is” in the surrounding world : crude oil, coal, falling water, fissile atoms, etc, as opposed to final energy, that designates forms of energy that we can use for our applications but are not found as is in nature: electricity, refined petrol, etc).
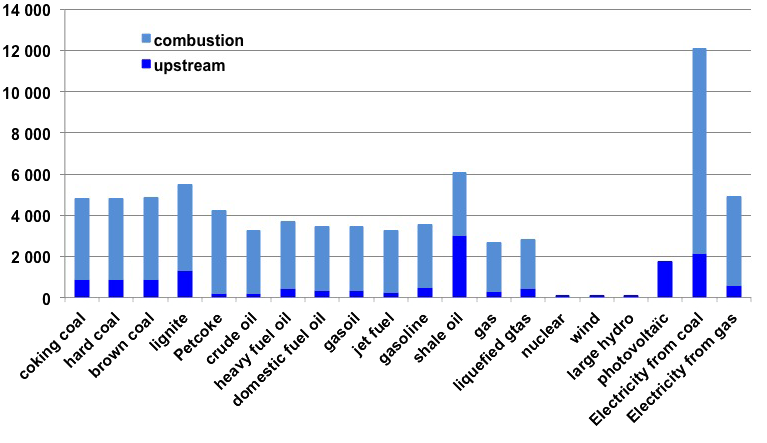
“Greenhouse gas content” (actually essentially “carbon content”) by tonne oil equivalent of final energy, for various types.
Purely electric sources (nuclear, wind, hydro, photovoltaïc) is converted with the final energy equivalent (1 TOE = 11,6 MWh). The carbon content for PV is with “coal rich” electricity in the country that manufactures the cells.
Upstream represents the emissions occurring in the process of extracting, transporting and refining fuels.
Sources : Author’s calculations on various sources : PNUE, ADEME, EDF.
This figure already allows to see that, for a given energy consumption, CO2 emissions may vary a lot depending on the energy mix we decide to have (or are able to have…). It happens that most of the energy presently consumed in the world leads to CO2 emissions (pie chart below), and the only way to decrease the “carbon content of energy” is to increase the share of “carbonless energies” (renewables, nuclear, and carbon capture and storage) in the mix.
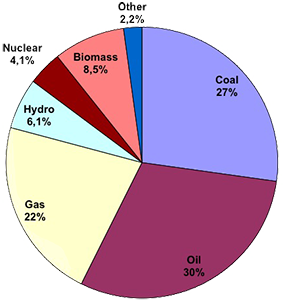
Breakdown by source of the world primary energy consumption in 2012.
The “primary energy” is the one we have at our disposal in nature (crude oil, coal and gas, uranium nucleus, water falls, sun rays, geothermal heat, etc).
The energy we use to power our device is not primary energy, but “final” energy: refined oil products, purified gas, and… electricity (which is not a primary energy, and which is as “clean” as the primary energy we have used), etc. Hydrogen, if we use it some day, is also a final energy, and thus also as “clean” as the primary energy we have used to produce it.
“Carbonless” energies represent 20% of the total: wood, hydro, nuclear, other.
Source : BP Statistical Review, 2013
We can go on repeating the same operation of multiplying and dividing the right part of the equation by the same term. We will not do it with the GDP, which is the unit that “measures” our economic activity.
CO2= \frac{CO2} {TOE} \times \frac{TOE} {GDP}\times{GDP}
TOE/GDP is the amount of energy we have to use to get a dollar (or an euro, or a pound, or a peso…) of GDP. We have now written:
\text{\scriptsize{CO2 emissions}}=\text{ \scriptsize{Carbon content of energy} }\times \text{ \scriptsize{Energy intensity of economy}}\times \text{ \scriptsize{GDP}}
It happens that energy intensity is on a decreasing trend since the beginning of industrialization, because the efficiency of techniques has always progressed, in first approximation, but not at such a pace that we divide it by ten every other year.
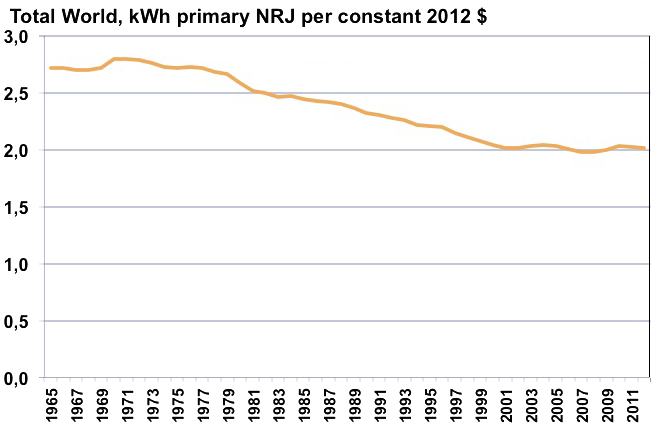
KWh of primary energy used per constant dollar of GDP since 1965.
The energy content of the economy decreased by a little less than 30% between 1970 and 2012, and actually since 2000 it has remained about flat, which means that over the 1970-2010 period it has decreased by a little over 0,5% per year on average. At what speed can we progress for the world as a whole in the four coming decades ?
Sources : Author’s calculations on data from BP Statistical Review, 2013, and World Bank, 2013
Even though this value is decreasing, it is easy to understand that focusing on this sole term of the equation – something that is quite frequent among my fellow engineers that are strong “energy efficiency advocates” – is forgetting the rest, and in particular failing to debate the following question: are we certain that if the energy intensity of the economy decreases it is not essentially because….the GDP increases faster than the energy consumption ? And actually it’s exactely what has been happening since the begining of the industrial revolution, more or less (energy consumption increases slower than GDP, but nevertheless it increases…).
Eventually we must now include demography to start an interesting discussion. Let’s call POP the world population, and let’s multiply and divide the right side of our equation by this term, what leads to:
CO2= \frac{CO2} {TOE}\times \frac{TOE} {GDP}\times \frac{GDP} {POP}\times{POP}
Translated into English, we have now written:
\text{\scriptsize{CO2 emissions}}=\text{\scriptsize{Carbon content of energy} }\times \text{\scriptsize{Energy intensity of the economy}}\times \text{\scriptsize{Production per person}}\times \text{\scriptsize{Population}}
The ratio GDP/POP is of very frequent use, and can indistinctely be called “production per person” or… wealth, even though we could discuss the real meaning of that indicator ! We have now expressed the CO2 emissions (but the same reasoning could apply to all greenhouse gases) as a function of terms that economists are accustomed to. Now, the interesting debate begins !
What can we do of all this ?
The first obvious conclusion of our little game is that focusing on one only of the terms is not sufficient to reach a solution to the issue of excessive fossil fuel burning (or excessive fossil fuel imports). For example, when Mr. Bush said that he would fight climate change by cutting the energy intensity of the american economy by 18% in 10 years, it is easy to see that this “only” meant that the term TOE/GDP should decrease by the same percentage. And what about the rest ? If the economic output per person (GDP/POP) rises by 25% in the same time (that is à 2,5% annual growth, a conservative objective !), with a population (POP) rising by a couple % (simple prolongation of trends), and a carbon intensity of energy staying the same (reasonnable assumption given the present trends, particularly in the electricity sector), the result will be a growth of CO2 emissions, not a decrease !
Let’s get back to the subject : it is established that to stabilize the level of CO2 in the atmosphere (that is to halt the present “CO2 enrichment” of the air) we must divide the world emissions by 3 at least – compared to the 2010 level – before 2050. In the above equation we should therefore aim at a division of the left term by 3, and as we should still have an equality it means that we must also divide the right term by 3.
What are we going to divide ?
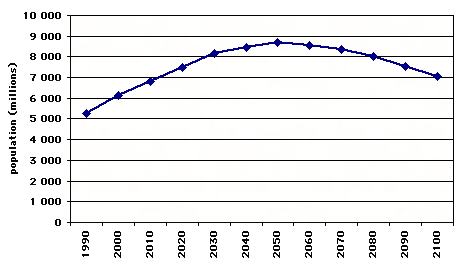
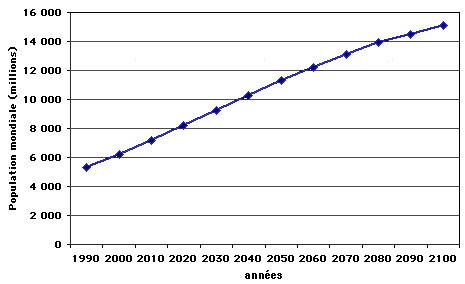
- Can we divide the world population by three ? Implementing such an objective in a plannified and fast way (40 years, it’s not much time) bearing the unpleasant name of genocide, it does not seem likely that it will be considered a serious option by anyone. And relying on an outbreak or nuclear war to do the job for us can hardly be wished !A prolongation of trends rather concludes to a multiplication of the population by 1,3 between 2010 and 2050
We now end with 1,3 times more people on Earth, while emissions shoud be divided by 3. A reasonnably awake high school student willthus correctly understand that the combination of the other factors should be divided by 4.
- Looking at the next term from the right, we then have an easy solution: divide the economic output per person (GDP/POP) by 4 ! Well… mathematics and our desires then oppose a little, for a deliberate choice of a recession is generaly not the option priviledged by leaders in most countries in the world. But… it does not mean that it won’t happen ! And actually recessions will happen more and more often from now, in the short term because of the upstream constraint on fossil fuels, and in the longer term because of the downstream constraint (climate change), that will degrade a number of natural assets that are essential to an economic output, even if we don’t measure it – though don’t realize it.But today, we all wish that “growth” goes on, among “rich” countries as well as among “poor” countries. A very conservative estimate of a 2% growth of the economic output per person, what is well below what every elected representative tries to promise, increases the ratio GDP/POP by 2,2 in 40 years, leading to an overall increase of the GDP of 2,8 between 2010 and 2050. The remaining terms on the right hand side of the equation therefore have to be divided by over 8 to ensure that CO2 emissions are limited to a third of the 2010 level in 2050.Before we go on, let’s recall that economic growth designates only the growth of the output of goods or services that are man made, but accounts for zero the concomittent and irreversible vanishing of non renewable resources – ores, fossil fuels… – that are necessary for our production, as well as the future degradations due to pollutions of all kind, including climate change. Taking this second factor with figures that are not more stupid than anything else could easily bring us to the conclusion that we are already declining.
We now have a division by 8 to 9 to perform on the following expression:
\text{\scriptsize{Carbon content of energy} }\times \text{\scriptsize{Energy intensity of economy}}
- Can we divide the energy intensity by 8 in 50 years ? It has decreased by 30% in 40 years in the world (chart above) ; the prolongation of such a rate yields an additionnal decrease of 30% in 40 years. As it is difficult to imagine a set of rules (norms on cars, on buildings, on industrial machines…) that can be implemented in an authoritarian way in more than 190 countries at the same time, we will suppose that prolongating the trend is an acceptable baseline. The energy intensity of the economy would therefore decrease by 30% in 2050, and we end with a division by 5 to perform on the ratio GHG/TOE
- In other words, the “carbon content of the energy” should be divided by 5 at least, in a context where the global consumption would be multiplied by two, because the product of the three terms:
\text{\scriptsize{Energy intensity of the economy} }\times \text{\scriptsize{Production per person}}\times \text{\scriptsize{Population}}
is nothing else than the energy consumption.
Question : what sources could be called upon to drive such a change, knowing that in the last 40 years that factor has decreased by only 10% ?
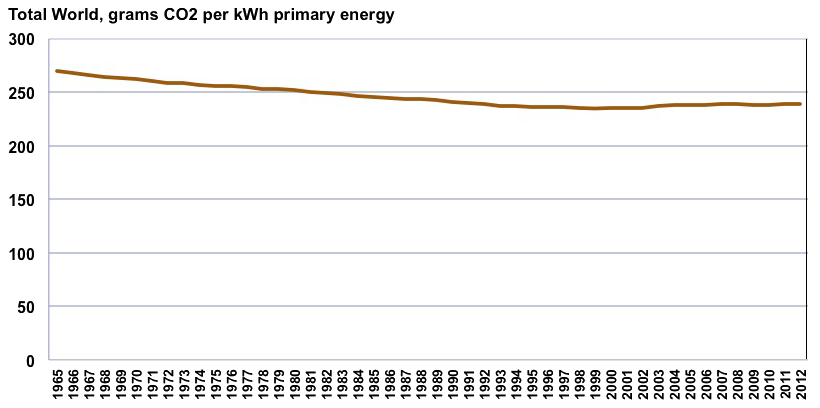
Evolution of the amount of CO2 emitted to use one kWh of energy since 1965.
In 2012 the CO2 content of energy has decreased by a litle over 10% compared to 1965, and a little less than 10% compared to 1970. Since 2000 this indicator has degraded and not improved, because of the fast rise of coal in China. What this curve says is that to get one kWh. And this ratio should decrease by 80% in 40 years!
Sources : Author’s calculations on BP Statistical Review, 2013, et World Bank, 2013
To achieve both goals (growth of GDP and decrease of CO2) we should have fossils fuels decreasing by 2,7% per year, while “carbonless energies” (renewable and nuclear altogether) should increase over 5% per year, to be multiplied by almost 8 in 40 years.
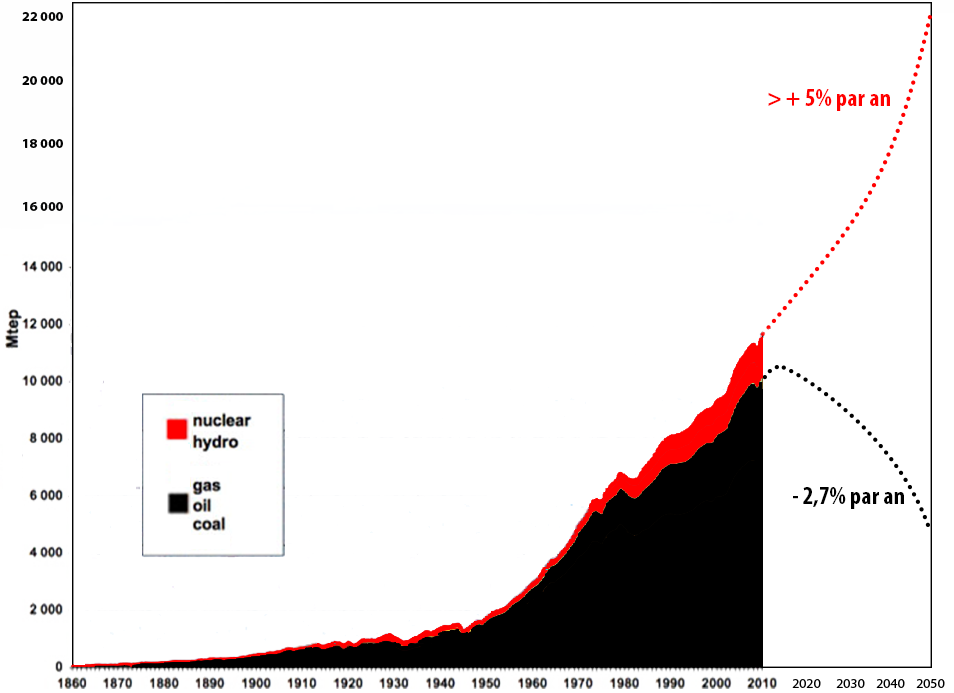
Global evolution of the world energy supply – in million tons oil equivalent – to achieve both economic growth and a division by three of the CO2 emissions in 2050.
The graph begins with the historical increase and wood is not represented (but it is included in the calculation of the growth rate of “carbonless energies”).
The representation of renewables except wood is limited to hydroelectricity, which in 2010 is an excellent approximation
Question: can we multiply the output of nuclear and renewables by 7 in 40 years ? (and obviously if the world decides to dismiss nuclear energy it increases a bit the call on renewables, see below). Let’s begin with renewables, which, in 2010, gave humanity a fat 15% of its primary energy consumption (electricity is accounted for with a primary equivalent), that is 2,1 billion tonnes oil equivalent.
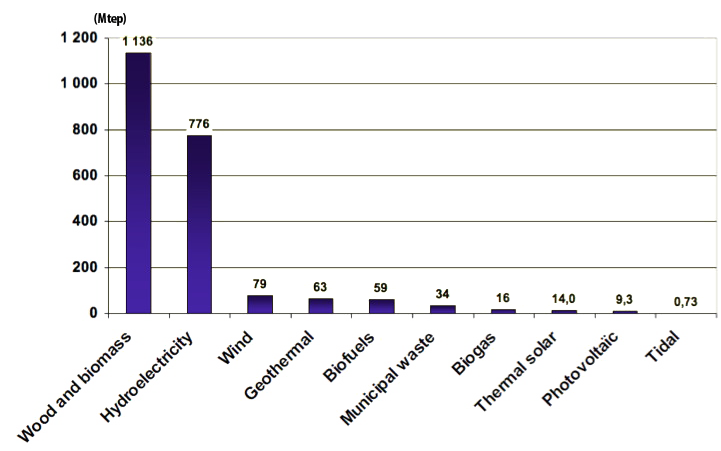
Breakdown of the world renewable energy consumption in 2010, in millions tonnes oil equivalent (1 tonne oi equivalent = 11600 kWh ; electricity is converted with the primary energy equivalent).
The world uses 12,4 billion tonnes oil equivalent (that is 12 400 million, if I still know how to multiply by 1000), which allows to see that wood represents about 10% of the world total, hydroelectricity a large 5%, and then all the rest is marginal.
Sources : various
Can we multiply by 7 the whole renewable supply ? To find out, let’s go on playing the stupid game of “elemntary mathematics”:
- Multiplying the wood supply by 7 would lead to 8 billion tonnes oil equivalent per year, with no deforestation. It happens that, with just 10% of the world total, wood consumption is already leading to deforestation (10% to 20% of the world wood consumption corresponds to deforestation). Let’s assume that this issue is solved, just for the sake of going on. An hectare of forest gives about 3 tonnes oil equivalent of wood each year when managed in a “renewable” way (which means that the annual crop is no more than the annual growth). Therefore getting 8 billion tonnes oil equivalent of wood (or biomass) means 33 million km2 of forests dedicated to energy production, that is 20% of emerged land or… the equivalent of present forests. If we use crops with a higher yield (say 5 to 6 tonnes oil equivalent per hectare and per year in net output), it still means 50% of the surface covered by woods or by croplands. Not a piece of cake… and if we should use algae culture in the deserts to do so, solid caluculations have still to be made on one hand, and the issue on the average growth rate which is debated below for wind also remains.
- Can we multiply, in the same time, the output of hydropower by 7 ? In a number of zones it mihgt be considered, with significant nuisances along (large dams mean large nuisances, and small dams mean marginal productions…), but not in Europe, where most of the potential has been equiped.
- All the other sources (biogas, biofuels, wind, photovoltaïc, etc), even multiplied by 7, remain totally marginal compared to a doubled energy consumption, and they should be multiplied by far more than 7 in the coming 40 year to make for the difference. Incidentally we can notice that for renewable energies, there is a law that applies pretty well in most occidental countries: their real contribution to the world supply is a reverse function of the number of pages they have in the media !
- Let’s suppose, for example, that we wish to settle our problem with mostly wind power, a very fancy item among renewable advocates. If we want to get 22 billion tonnes oil equivalent of total energy in 2050 while dividing CO2 emissions by three at the same time, and if we suppose that wind power makes for most of the “carbonless energy” which is needed, we should increase wind production by 14% per year over 40 years, which means a multiplication by… 160 in 2050.It also means that 12,7 billion tonnes oil equivalent would come from wind.
14% per year, after all, should not afraid anyone given the present growth rates.
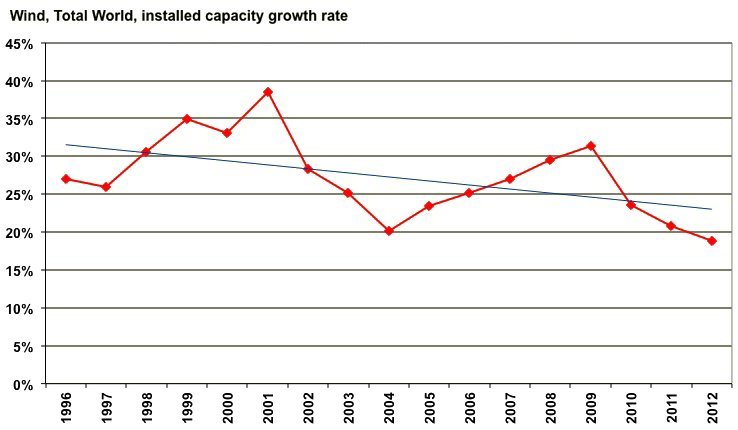
Annual growth rate of wind intalled capacities in the world since 1996.
Sources : BP Statistical Review 2013
But now let’s open a history book: for how long have fossil fuels – that have replaced renewable energies, and there must be a reason ! – sustained a growth rate over 14% ? Answer: not that long…
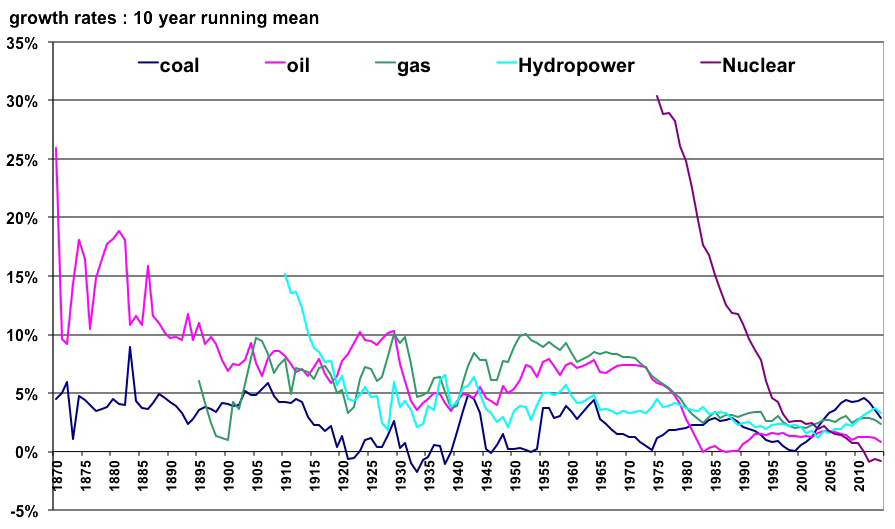
The above curves represent, for each mainstream energy, the 10 year running average of the growth rate since 1860.
The value is for the end of the 10 year period, e. g. the value for 1960 represents the average growth rate for the period 1950-1960. The value for 1940 represents the average growth rate for the period 1930-1940, etc.
Except for oil at its early stages (it then represented only several % of the world supply) no major source has kept a growth rate over 10% for 50 years. As soon as an energy becomes “mature”, its annual growth rate fall below 5%, and one should keep in mind that these growth rates occurred in a world where the productivity was increasing, as a result of the increase of the energy available per capita.
It is therefore a bold assumption to make that “uneasy energies” (such as wind, diffuse and intermittent) will be able to sustain higher growth rates than “easy energies” (such as fossil fuels, very cheap to extract and giving very high power on demand), what’s more in a world where the productivity of “physical” work should decrease… precisely because of a lack of “concentrated” energies (it’s this productivity that counts to build grids and power stations, and… windmills).
Source : Schilling et. al and BP Statistical Review for primary data, growth rates from author’s calculations
In other words, the most probable forecast for wind is that as soon as it becomes “thicker than the line” its growth rate will slow down (there are excellent “physical” reasons for that). The same evolution can be forecast for photovoltaïcs, which today amounts to a tenth of wind power (or 0,07% of the world primary energy supply).
A slowing of the growth rate of wind does not mean that its share will not increase: if wind remains at the present level but fossil fuels are divided by 4, the share of wind power will mechanically increase. But in such a case one will easily check that the hypothesis of a GDP growth rate of 2% is not verified !
Then comes nuclear: multiplying the production by 7 means that within 40 years we should have 3.000 reactors of 1000 MW up and running. 3000 units is about the number of coal power plants operating right now, and it represents 10.000 billion dollars of investments. Knowing that the present world GDP is somewhere around 60.000 billion dollars per year, it is not completely ridiculous as far as money involved is the only issue, and it would not be completely impossible with the know resources in fissile (235 uranium) and fertile (238 uranium and 232 thorium), but it supposes to deploy breeders as fast as possible. And if we want to phase out fossil fuels mostly callin on nuclear because the above calculations suggest that renewable won’t do enough of the job, it’s rather two to four times that amount that we should aim at.
Can we be serious on both GDP and climate at the same time ?
Of course, another alternative is to consider from the very start that “degrowth” will be a normal process in the future (which means that the global amount of material flows per individual is bound to decrease). It is kind of equivalent to accepting that a kind of diet is a desirable evolution. We do not want that, of course, as Tocqueville has correctely guessed more than a century and a half ago. But even if we don’t wan’t to, can we avoid it ?
It happens that a division by three of the present CO2 emissions (the term on the left of the Kaya identity) is unavoidable “one day“. Indeed, mathematics impose that, if we have a stock that has been given once and for all, the yearly extraction coming from this stock is bound to start from zero (that is easy to verify !), go through a maximum, then tend again to zero with time. Fossil fuels fulfill the only necessary condition: the initial stock is given once and for all. Therefore their extraction – thus consumption – will peak one day, and decline thereafter, And obviously, CO2 emissions that arise from burning fossil fuel cannot do something else than following the same curve than fossil fuel use.
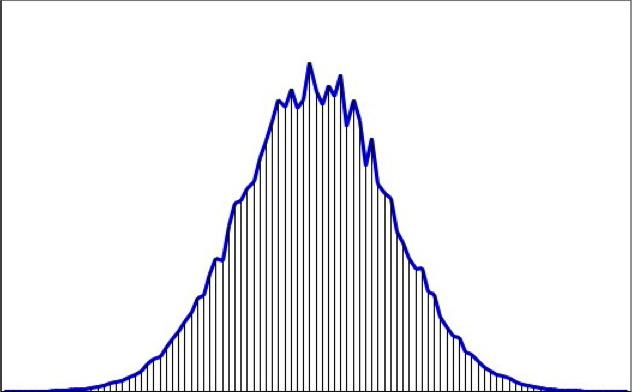
General aspect of the extraction (over time) of a resource for which the initial stock is given once and for all.
The surface below the curve is the cumulated extraction and its value from beginning to end is at most equal to the initial extractible stock (which for oil is called an ultimate reserve).
Human borne CO2 emissions will behave the same way. The only question regarding the maximum is when at the latest, how high at most, and what process will lead us through (our will, or the collapse of our industrial society, everything can be considered !).
Well, if CO2 emissions have to tend to zero with time “some day”, il means that there will come a time when world emissions will be forever below a third of the present value. We do not know exactely when and how it will happen, but it is absolutely certain that it will happen, and probably not in three centuries.
In this kind of context, which will most probably include a set of recessions, it is not sure that engineers will be able to go fast enough on “efficient economy” (the ratio TOE/GDP basically refers to all that engineers can do to make more efficient cars, coffee machines, houses, and trains) and on “carbonless energy” (the ratio CO2/TOE basically refers to all that engineers can do to increase the share of renewables, nuclear, and carbon capture and storage in energy supply) to allow a division by 9 in time of the “carbon content of the economy”. Such a division by 9 is indispensable, though, to have both economic growth and CO2 emission declining (and the latter will eventually win).

The main characteristic of an identity being that both sides remain equal, it means that a division by 3 of the left term “one day” will necessary translate into a division by the same number on the right at the same time. Because of what is mentionned above, the most probable outcome is that it will come from the terms POP and/or GDP/POP, and that the more we wait to “decarbonize” the economy, the harder we will fall.
Ironically, in such a context, all politicians that advocate to phase out nuclear first to make the world more stable are paradoxally contributing to exactely the opposite, by suppressing one of the possibilities to lower the ratio CO2/TOE as fast as possible, which therefore increases the probability that the term GDP/POP and POP get hit harder when CO2 decreases, because it’s only maths. Saying that phasing out nuclear power plants increases the risks of wars and starvation is not the least puzzling, I suppose, for an ecologist militant, sincerely convinced that nuclear energy is the worst of things !
And maths are also definitely hateful for all classical economists: with this bl… GDP, a “stable recessive state” will be very hard to avoid, not because it is desirable, but because, alas for us, our world is a finite one. Therefore keeping the GDP as the main thing we want to grow would not be very wise: keeping an indicator that will most probably behave more and more often differently from what we wish is not compatible with a positive mindset. We’d better move to something else !
