MEADOWS Donella, MEADOWS Dennis, RANDERS Jørgen, BEHRENS William W.III, The limits to growth, Universe books, 1972
(205 pages)
NB : you may acess the book online.
The year 1968 is frequently associated, for us French, to a joyous mess that happened within the working class and the student world, and which is supposed to have generated a decisive change in the way we look at the world. Actually, 30 years after, one might be doubtful of it: among those that shouted the loudest against the “consumption society” and wanted to overthrow the “established order” at the time, a large number have now become fervent supporters of both !
But it is also possible to associate this year to the creation of a body that will “make a lot of noise” a couple of years later, even if its birth did not raise so much attention: the Club of Rome. At the moment of its creation, it gathered a handful of people, holding quite important positions in their respective countries (a german university rector, a director at the OECD, a vice-president of Olivetti, a special advisor to the japanese government…), that wished that serious scientific works be done on the evolution of the world to try to grasp the limits to growth.
It is nevertheless not in 1968 that the famous “report” was published, but a couple of years later, in 1972, and it is not the members of the Club of Rome that wrote it, but a team of research workers from the Massachussetts Institute of Technology (or MIT) that was constituted specially on this occasion, following a request by the Club of Rome. It would therefore be more accurate – and fair – to name that report currently designed as “report of the Club of Rome” by its true name: the Meadows & al. report (after the name of the person heading the team, Dennis Meadows). This report is composed of a synthesis report, showing the main results of the work that was done, and on which I try to make a couple of comments below, and various annexes.
What was there in this famous report ?
The Meadows & al. report is probably, just like the IPCC report on climate change today, among these documents that 99% of the people that quote them never read, given the quantity of conclusions supposedly included in this paper that are not found once it is read. For example, it is frequent to hear (at least in France) that the Club of Rome (actually the Meadows team) had “predicted” the end of oil for 2000, which obviously did not happen, and hence that it is urgent not to pay any attention whatsoever to this prospective work, that can only derive from the fantasies of some individuals terrorized by the future. But there is no such prediction of an oil shortage for 2000 in the Meadows report !
There is, page 174 of the french translation, a table showing that the known oil reserves, in 1970, represented 30 years of consumption (without taking the annual growth in consideration). But it was not a “forecast”, allowing to conclude that oil would be definitely exhausted in 2000, just a reminder of the knowledge at the time regarding natural resources ! May we say today that oil companies “foresee” the end of oil for 2040, because the reserves they declared in 2000 represent 40 times the annual consumption of 2002 ?
Actually, not only did this report never foresee the end of oil for 2000, but it didn’t foresee anything else in a precise way. Its sole strong conclusion is that perpetual material growth will lead sooner or later to a “collapse” of the world that we live in, and that, even with very optimistic hypothesis regarding the development of efficient technologies to come, the ability to recycle or to save natural resources, the mitigation of pollution, or the initial stock of non renewable resources that we begin with (the high end of the bracket for the initial stock of non renewable resources was 5 times the known reserves in 1970, and, for oil, that leads to higher reserves in 2000 than what we really have today, given what we have consumed meanwhile; I checked !), this collapse will happen before 2100.
By “collapse”, one should not understand the end of humanity, but a sharp decrease of the population, along with a significant degradation of the living conditions (decrease of the industrial output per capita, of the food output per capita, etc) for the surviving fraction. Anybody who is willing to put forward the “report to the Club of Rome” to justify the blindness of its authors will have to wait until 2100 to be able to do so !
To get to this conclusion of a probable collapse, which indeed is not a mild one, the researchers have done what is now of current practice in many disciplines : they have built a numerical model, a tool noone can now let aside when trying to guess the future for a complex system is the name of the game. Computer (or numerical) models are now used by astrophysicists, oceanographs, agronomists, physicians, biologists, demographs, climatologists of course, and more generally by any physicist, chemist, or biologist, not to mention all the disciplines that concern engineers…. Actually, there is not a single scientific or technical discipline, today, that doesn’t use a computer – therefore a model – as a main or auxiliary tool for the research done.
The complex system modelized by the team of the MIT, here, is nothing else than humanity, and the numbers that characterize it, roughly several tens, are named global population, arable land per capita, remaining natural ressources, food output per capita, industrial production per capita, pollution level, etc.
Several dozens of links or feedbacks tie these variables together. For example the growth of pollution influences in a negative way the life expectancy, and therefore the size of the population, what in return tends to lower the emission of pollutants; the growth of the industrial output per capita contributes to the growth of the industrial capital, what generates a growth of the agricultural output, but also a growth of the pollution, etc. The qualitative description of some of these links is given below to illustrate the idea.
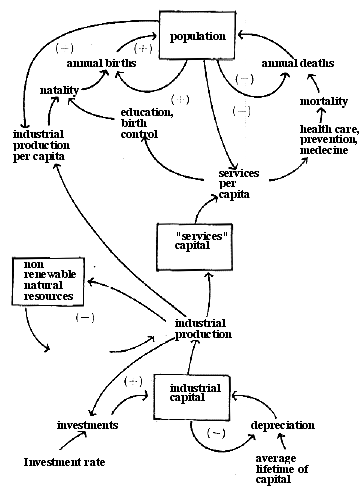
Qualitative description of the interactions included in the model between population, capital, services and resources.
These “links” might be linear (which means that the consequence is proportionnal to the cause) or not, include a time lag between the cause and the effect or not, include a threshold or not, etc. The complete list of the laws that govern these variables is included in one the annexes of the report, the main document mentionning that all the “laws” and initial values have been validated by some experts for each field. As I did not read the annexes, I don’t have any opinion on the values and laws that were selected, but the examples presented in the main report do not incline to consider that the researchers have been totally irrelevant in their choices.
For fossil fuels, for example, for which the values and growth rates of the various scenarios studied are mentionned in the main report, the researchers have probably been a little “severe” in the purely tendencial scenario (they did not explicitely foresee the 1974 and 1991 oil shocks, and the associated recessions !), but the growth that we have experienced remains higher than what it was in another scenario assuming a huge progress on energy efficiency in 2000 compared to 1975.
| Fuel | Average annual growth of the consumption between 1900 and 1970 (real data) | Average annual growth of the consumption between 1970 and 2000 (real data) | Value selected in the "baseline" scenario | Value selected in the "efficiency" scenario |
|---|---|---|---|---|
| Coal | 1,7% | 1,6% | 4%±1% | 1%±0,25% |
| Oil | 6,9% | 1,4% | 4%±1% | 1%±0,25% |
| Gas | 7,5% | 3% | 4,7%±0,7% | 1,2%±0,2% |
If the work of the Meadows team is not equal to a forecast, what the authors themselves frequently recall, since it does not take into account all the variables that characterize the real world, all precautions were taken – among which a large variety of sets of hypothesis, as we will see below – so that the indications given were qualitatively as trustworthy as possible.
In short, this “famous” report, that some accuse today of having all possible flaws because no disaster happened yet (!), is nothing else than a scientific paper a little long, presenting the research work that was done to build a model, use it, and the results obtained.
What results did the model yield ?
1. Natural resources equal to the known resources
The first figure shown in the Meadows report is how the model behaves with the known reserves of 1970 and no change in the evolution laws. Indeed, with these hypothesis (more pessimistic than what really happened), problems do start pretty soon after the beginning of the XXIst century.
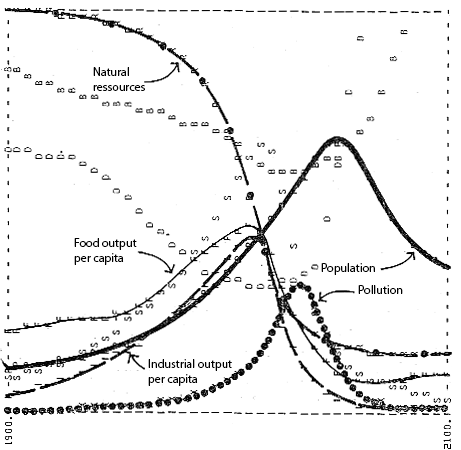
Evolution of the main variables studied between 1900 and 2100 with natural resources equal to the known resources in 1970.
Of course, from 1900 to 1970 the model reproduces fairly the real evolution of these variables.
The perpetuation of the “growth” leads to a collapse of the living conditions (food output per capita and industrial output per capita) at the beginning of the XXIst century, the values obtained in 2100 being much lower to what they were in 1900. What triggers the collapse is here the exhaustion of non renewable resources.
2. “illimited” natural resources
But, thought the members of the Meadows team, we might have been too pessimistic on the initial conditions. Let’s now suppose that the non-renewable ressources are in fact almost infinite, which includes that they can be almost totally recycled, and that the availability of energy is not a problem any more (and that’s much more optimistic than what really happened). The corresponding “laws” are adapted in the model, and some initial values changed. Then what happens ?
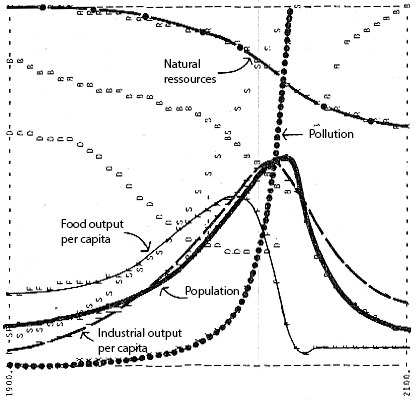
Evolution of the main variables studied between 1900 and 2100 with “illimited” natural resources.
It is not the exhaustion of natural resources that lead to a collapse, but the “explosion” of pollution. In the model, it then leads to a decrease of the agricultural output, that regulates the population. Let’s note that the common word used for a regulation of the population caused by a decrease of the agricultural output is….starvation.
3. “Illimited” natural resources and pollution control
Since pollution is THE problem in this simulation, our researchers say, we will now assume that human intelligence will allow to control it, that is divide it by 4, while keeping the optimistic hypothesis regarding resources. Let’s note that this “pollution control”, in the report to the Club of Rome, includes a generalized call on nuclear energy. The supporters of this form of energy will conclude that the “ecological” side of nuclear energy is accepted without problem by the same individuals that seriously wonder about our future otherwise, and the opponents will conclude that calling more on nuclear energy does not prevent, “everything else remaining equal otherwise” (particularly the desire for perpetual growth), the same kind of “end”, what can be seen below. Both are right from my viewpoint also !
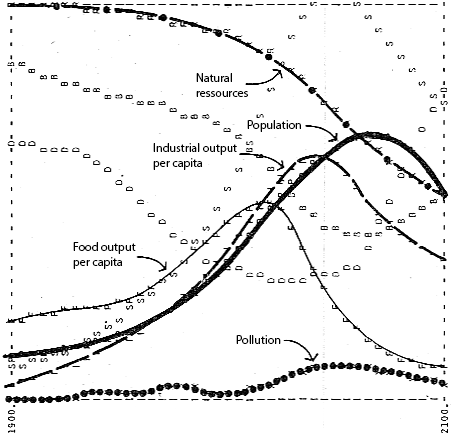
Evolution of the main variables studied between 1900 and 2100 with “illimited” natural resources and pollution control.
The final evolution is only differed by a couple of decades.
The pollution control allows for an important transient population growth, that eventually leads to an irreversible soil degradation, itself causing a decrease of the agricultural output per capita. We eventually find – again – a regulation caused by starvation.
4. “Illimited” natural resources,pollution control and increased agricultural productivity
Going on with their investigations, the researchers now suppose that the agricultural productivity can be vastly increased, what alleviates the problem of the limited availability of arable land. What then ?
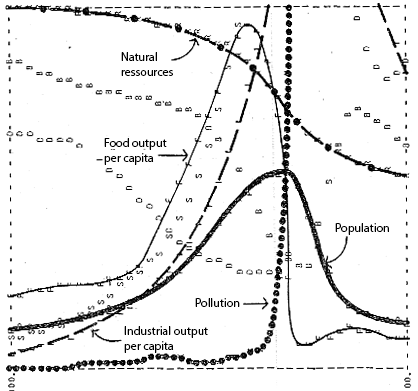
Evolution of the main variables studied between 1900 and 2100 with “illimited” natural resources, pollution control, and increased agricultural productivity.
The population spending less time to grow food, humanity can increase its industrial production (since natural resources are not limited) and, in spite of pollution control, the latter “explodes”, causing (in the model) a vast land degradation then a decrease of the population.
Let’s suppose now that we can obtain a perfect birth control, say the researchers, so that the population stabilizes to avoid an explosion of the global industrial production caused by the demographic expansion. What happens ?
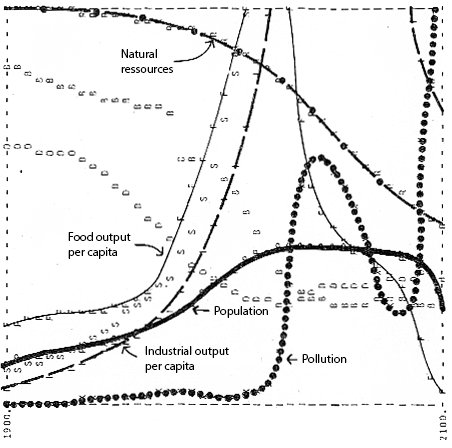
Evolution of the main variables studied between 1900 and 2100 with “illimited” natural resources, pollution control, increased agricultural productivity and perfect birth control.
After a transient stabilization the situation evolves the same way than for the previous set of hypothesis: it is the burst of pollution, caused by the burst of the industrial output per capita, that eventually degrades land, causing a starvation that regulates the population. The eventual collapse is differed by a couple decades only.
The conclusions of this work are therefore simple: as long as the global model includes some specific rules, particularly the aim of a perpetual growth of the industrial output per capita (which is the project of any country today), a final collapse is unavoidable before the end of the XXIst century no matter how optimistic the other hypothesis are.
The only possibility to avoid this brutal collapse is to limitate volontarily the industrial output (and a number of other physical values included in the model) to a level compatible with the possibilities of our planet : it is the “economic growth” that starts to be questionned, since from the beginning of the industrial revolution the economic growth is coupled to the growth of the industrial production.
Was it legitimate to question “the growth” ?
After the researchers realized that the “search for growth” lead to a collapse within a century with the model they used, while this model reproduced in an acceptable way the evolution of the real world from 1900 to 1970 for the variables studied, wondering whether we should limitate or halt the growth to avoid the final collapse is legitimate : there is no ideology there, just a question that would have come to the mind of any model specialist – not to say anybody reasonnably sound – put in the same situation.
Anyway, mathematics tell us that, in a finite world, any consumption of non renewable resources can only decrease to zero with time, like it or not ! There is no ideology in this conclusion either, just the conclusion drawn from a simple maths theorem, that says that if a function is positive and integrable, and if its integral has a superior limit, then its mean value over any strictly positive time interval can only tend to zero to infinity.
Any consumption of a non renewable resource complies with the hypothesis: the consumption is a positive function (we can’t give back oil to earth, or create copper ore from a magical wand !), integrable (we can calculate a cumulative consumption), and the cumulated consumption (in mathematical terms, its integral) has a superior limit (the maximal value is the initial stock). Thus, the annual consumption can only tend to zero with time. In other words, for the consumption of any non renewable resource, we have only the choice between a managed decrease of the consumption to keep a supply, though at a reduced level, for the longest time possible, or the just wait for the decrease to come on its own under whatever form it will take.
The only ambition of the work of the Meadows team, in a way, was to try to understand what chain of events could take place if we did not take any preventive measures, at what time horizon could such events happen, and if some particular options implemented for the whole world could postpone for a very long time an unavoidable collapse in the end. “Preventive measures” meaning stopping the expansion before it generated its own end, it had a sense to explore at what conditions it was possible to stop the growth while maintaining a consumption per capita and a life expectancy considered as “satisfying” (knowing that there is no scientific truth on what a “satisfying” level of consumption per individual is).
5. Stabilization of all the output variables studied (population, industrial output per capita, etc)
The authors have therefore “forced” the model to obtain a stabilization of all the output variables studied (population, industrial output per capita, agricultural output per capita, etc) and examined what it meant regarding the hypothesis. Multiple combinations are possible, or course, but the authors gave the following one as an example:
- the population is stabilized after 1975 (it was not really the case !)
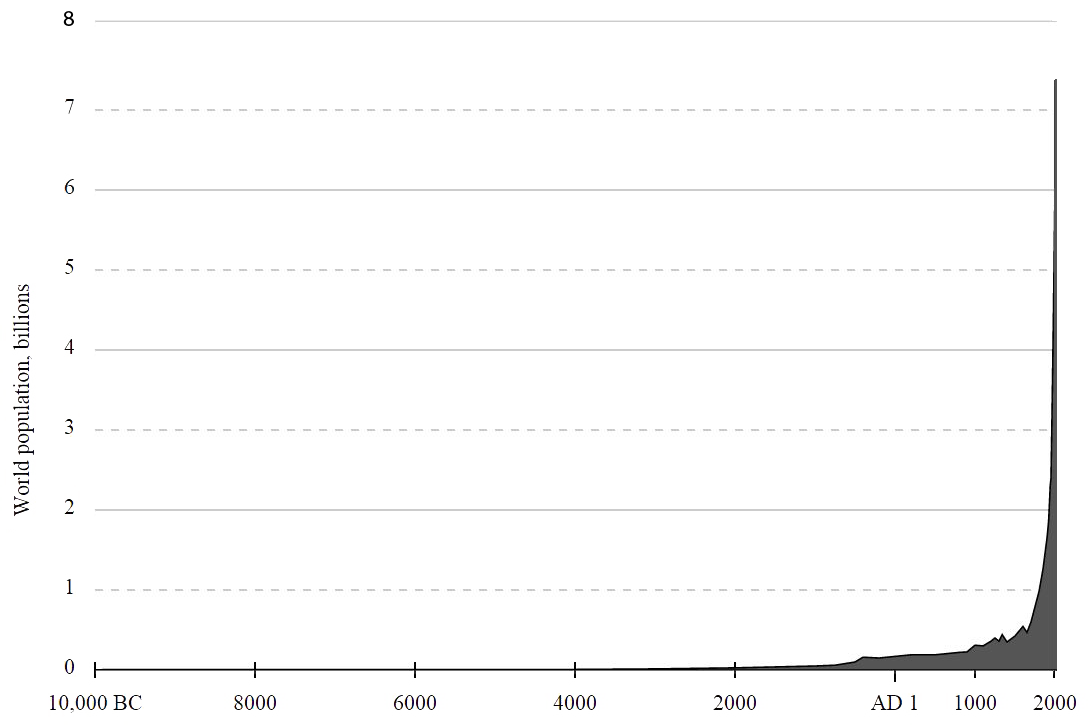
Demographic evolution since the beginning of the neolithic.
Humanity increased by more than 5 billion people between 1975 and 2016.
-
the world industrial capital is stabilized after 1990, by balancing the depreciation rate and the investment rate (this did not really happen either: the industrial capital is increasing all the time),
-
the consumption of non renewable natural resources by industrial unit is divided by 4 in 1975 (there are maybe rare exceptions but globally it has not been the case; for the energy for example – coming from non renewable ressources for 85% of the world supply – the decrease since 1970 is much smaller)

Energy intensity of GDP in the world, index = 100 in 1970 (blue curve).
The energy content of the economy decreased by 30% between 1970 and 2005, and actually since 2005 it has remained about flat, which means that over the 1970-2010 period it has decreased by a little less than 1% per year on average.
Source : Observatoire de l’Energie
- the proportion of the “economy” which is composed of services increases (no quantitative value mentionned, but this evolution is under way),
- the pollution by unit of industrial or agricultural output is lowered to a fourth of the 1970 level by as soon as 1975 (we are very far from there for most pollutants, including the greenhouse gases emissions for example, for which the decrease by industrial unit has only been of 15% from 1970 to 2000 in the OECD),
- the industrial capital is prioritarily devoted to agricultural production, and in this category to soil conservation (against erosion). I doubt that it is the present tendancy, but I might be badly informed.
- to preserve the non renewable resources, the lifetime of industrial capital increases, with increased lifetime for the production tools (today I would say that the tendancy is rather the opposite : investments have to be frequently renewed because of obsolescence), and enhanced reparation and renovation possibilities for these tools (I would not swear either that it is a main tendancy !).
With this set of hypothesis, the model stabilizes the industrial output per capita and the agricultural output per capita at 3 times the 1970 mean values, without having in the same time a burst of pollution.
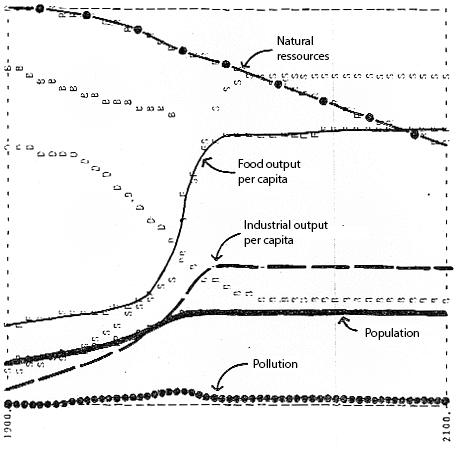
Evolution of the main variables studied between 1900 and 2100 with the above set of hypothesis.
Nevetheless one will note that the natural resources still decrease noticeably during the 21st century: it is perfectly possible – it is actually highly probable – that the “stabilization” lasts only a couple centuries (the authors did not mention what the model yielded over several centuries).
6. “Stabilization mesures” taken in 2000 (instead of 1975)
Indeed, if the “stabilization measures” described above are taken only in 2000 and not in 1975, that is when the residual natural resources have lowered a lot, and the cleansing capacity of the world has decreased a little, it is still possible to reach an equilibrium state, but it lasts only a couple decades before beginning the collapse that happens in all the simulations without any preventing measures (graph below).
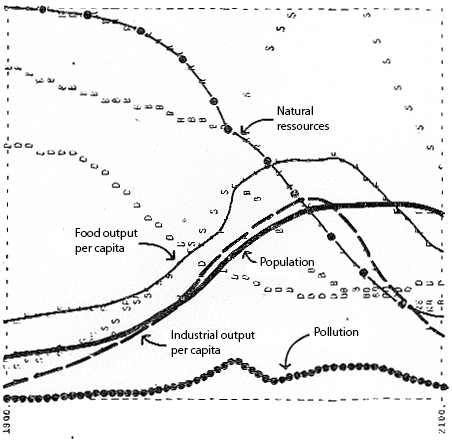
Evolution of the main variables studied between 1900 and 2100 with the set of hypothesis of the previous graph, but implemented 25 years later.
But, in spite of the results of these simulations, clearly upsetting, the authors of the report carefully avoid to advocate the halt to growth as a desirable project for the future, considering that such a decision can only be a political choice, but not a scientific truth. Therefore, all those that quote this report as advocating a generalized deprivation, against the will of the people, but for his own sake, most probably didn’t read it: the authors clearly mention that it is not among their prerogatives to advocate a halt to growth or to indicate the possible means to obtain it.
In the end, how reliable was the forecast?
When published this report made a lot of noise and then was progressively forgotten. Many observers discarded it based on a wrong interpretation, broadly and purposely shared by classic economists (those who put natural resources in their equation only based on the value given by their human owners at a precise time) and all the ones who were annoyed by the conclusions which are that the Meadows team predicted “World collapse” (and particularly the lack of oil) by 2000. In fact what happened to this report is the same as what happened to the IPCC’s one. Except that thousands of scientists are backing the IPCC’s report, scientists who spend a significant part of their time with journalists, countering stupidities propagated by some of these same journalists some time before (this is sadly becoming customary) whereas the Meadows’ one was based on about only 10 people. Not much compared to the thousands of classic economists they were confronted to.
But you just have to read the report (which most critics didn’t do unless they simply chose to discard its findings) to realize that the Meadows’ team did not predict anything with precise dates and that those so called “conclusions” were nowhere in the report. What stood actually inside were predictions on general trends and we can now honestly ask ourselves, how accurate they turned to be for the 1972-2000 period?
In 2008 an Australian scientist had the totally awkward idea to confront 1970-2000 historical data with 3 scenarios from the 1970 model. (“A comparison of the limits to growth with thirty years of reality“, Graham Turner, CSIRO, June 2008; all graphs here come from this publication, download here):
- “Stabilized world”, presented here in 1st position
- “Comprehensive Technology”, presented here in 2nd position (natural resources always recyclable, pollution controlled, and significant agriculture productivity growth).
- “Standard Run”, presented here in 3rd position
The first interesting comparison is obviously that of population evolution, presented here below.
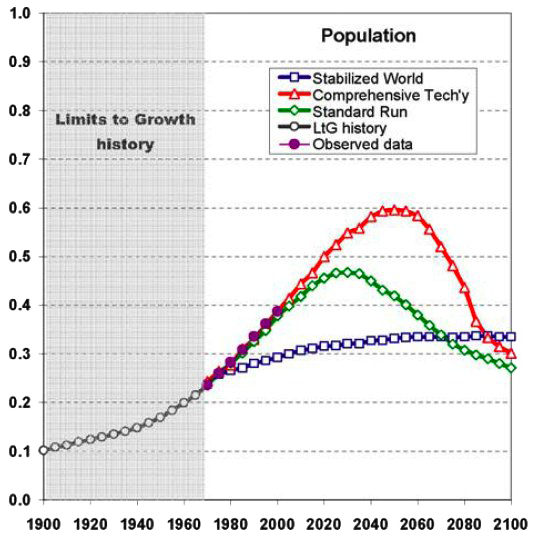
Normalized comparison for population of:
- the real evolution,
- the “standard run” simulation,
- the “comprehensive tech’y” simulation,
- the “stabilized world” simulation.
Two striking observations on his graph:
- On one hand the actual 1970-2000 evolution is relatively in lint with the 2 “finished world” simulations (“standard run” and “comprehensive tech’y”)
- On the other hand we are not on the way to a stabilized population, but if the retroaction loops modelled are correct, rather on the way to a growth followed by a slowdown
Another interesting variable to observe proposed by the Meadows model is the birth rate.
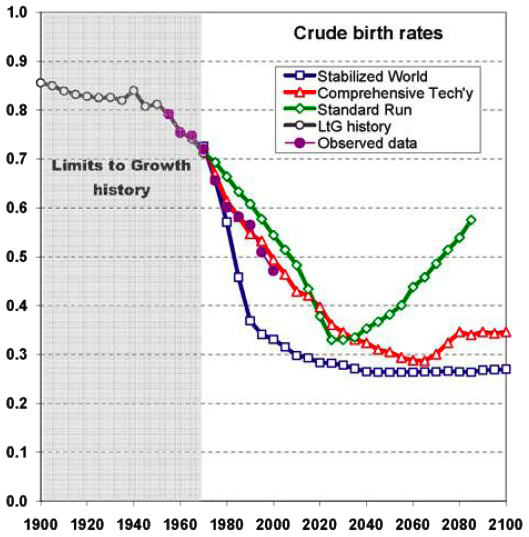
Normalized comparison for the birth rate of:
- the real evolution,
- the “standard run” simulation,
- the “comprehensive tech’y” simulation,
- the “stabilized world” simulation.
Again we have two main observations:
- the actual 1970-2000 evolution is relatively in lint with the “standard run” and “comprehensive tech’y” simulations,
- the birth rate remains too high compared to would have been required to achieve stabilization in 2000.
Let’s look now at the food production per capita, a characteristic of the “quality of life”.
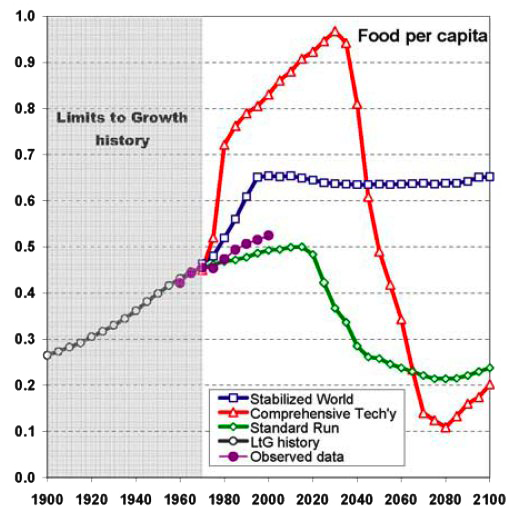
Normalized comparison for the food production per capita of:
- the real evolution,
- the “standard run” simulation,
- the “comprehensive tech’y” simulation,
- the “stabilized world” simulation.
What actually happened is approximately in line with the “standard run” simulation, and way lower what was forecasted by other simulations.
This makes sense, as the scenarios “stabilized world” and “comprehensive tech’y” involved significant efforts to preserve soils and increase the “natural” productivity of cultures (e.g. by using plants that make most of soil nutriments, of air nitrogen etc), and so far there is rarely focus on these efforts.
Another characteristic of “quality of life” is the industrial output per capita.
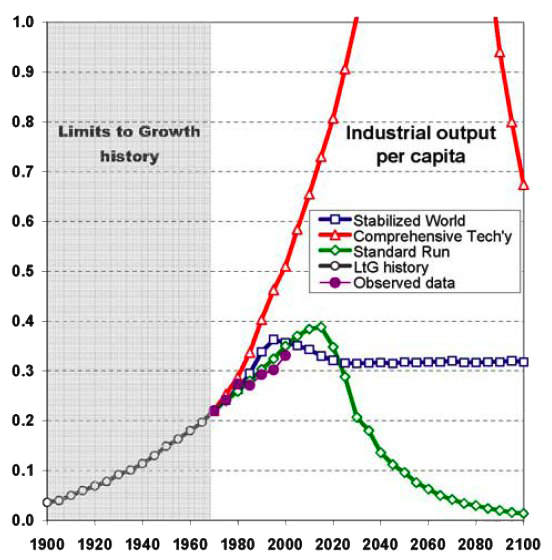
Normalized comparison for the industrial output per capita of:
- the real evolution,
- the “standard run” simulation,
- the “comprehensive tech’y” simulation,
- the “stabilized world” simulation.
The evolution nearly matches the scenario “standard run” with some oscillation most likely related to the consequences of the oil crisis in 1974 and 1979.
After industry, let’s look at services.
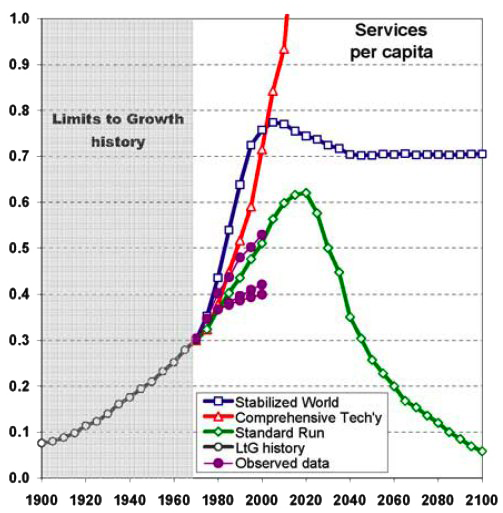
Normalized comparison for the services per capita of:
- the real evolution,
- the “standard run” simulation,
- the “comprehensive tech’y” simulation,
- the “stabilized world” simulation.
Because there are so many difference services types, all very different in kinds, with high heterogeneity from one country to another, it is almost impossible to define time series without creating an aggregate which can’t be interpreted. This challenge didn’t exist in the Meadows’ team simulation, as services were globally defined as any non-food and non-industrial human production. Also the links between services production and other data (see above) didn’t require a more precise definition.
For comparison purposes, better chose precise time series, and that’s the option chosen by the author of the publication from which these graphs are extracted.
The three purple dots lines represent respectively, from bottom to top:
- The % of youth population that can read and write
- The % of adult population that can read and write
- The % of people having access to electricity
Again, we notice that the « standard run » scenario is the closest to the actual evolution.
We are now getting closer to the moment of truth: the comparison of predicted and actual natural stocks used to sustain our economy, in particular the stocks of fossil fuels.

Normalized comparison for the stock of non-renewable resources of:
- the real evolution,
- the “standard run” simulation,
- the “comprehensive tech’y” simulation,
- the “stabilized world” simulation.
Purple dots are obtained with the following hypothesis:
- Global shortage won’t result of the lack of metallic minerals, because they can often substitute one another , e.g. copper and aluminium are interchangeable to produce electrical cables. Also stocks of iron ore are abundant.
- It is therefore fossil fuels who will be the main limiting factor for non-renewable resources, and it is the evolution of its extractable stock that is represented in purple
- In this context the lower purple line represents the remaining fraction of the initial stock (0.7 = 70%) assuming this stock is in the lower range of current estimations, i.e. 1400 billion tons oil equivalent (Gtoe), keeping in mind that so far we consumed approximately 400 Gtoe.
- The higher purple line represents the same thing, assuming this time that the initial stock is 3500 Gtpo (in which case there are 3000 Gtoe left of fossil fuels, mainly coal. Many geologists believe this estimation is realistic)
Again we notice that the actual evolution is somewhere between the “standard run” and the “comprehensive tech’y” simulations. The latter enables the small increase of the extractable stock, or to extract stocks of lower quality, as explained on the page on stocks
Finally, the last interesting variable to study is the one related to pollution.
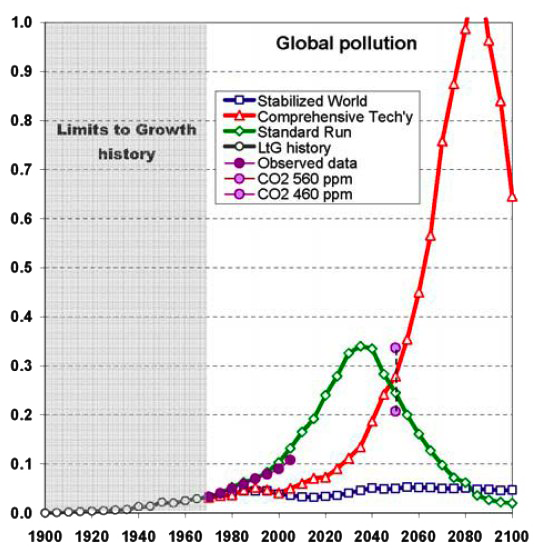
Normalized comparison for the atmospheric concentration of CO2 (considered as representative of the overall remanent pollutions) of:
- the real evolution,
- the “standard run” simulation,
- the “comprehensive tech’y” simulation,
- the “stabilized world” simulation.
Again we notice that the actual evolution is close to the one suggested by the “standard run” simulation.
In the end, what was the reliability of the “predictions” ?
When this report got published, it made a lot of noise, and then gradually fell into oblivion. Many, in particular, have burried it because since 1970 no catastropha has happened (and therefore we got afraid for nothing). But it seems to me, after a thorough reading, that this is judging a little fast. To begin with, the evolutions described by the model are not dated in a precise way, but could happen anytime during the XXIst century as long as our project is perpetuating the growth (which is still the case, no doubt about that !), which means that it is premature to conclude that the authors were wrong.
But, most of all, something striked me when I read this document: the similarity between the evolution described in the Meadows report, and climate change, that was not a major preoccupation at the time, even if the physical basics were already long known. Indeed:
- the “global” pollution, due to the surplus of the 3 main greenhouse gases in the atmosphere, increases exponentially, as the agricultural output for methane and nitrous protoxyde, or as the industrial output for the CO2, exactely as the variable “pollution” in the model of the Meadows team:
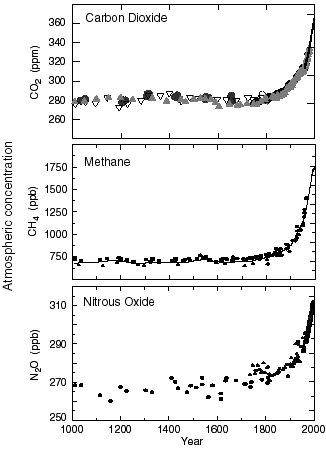
Evolution of the atmospheric concentration of carbon dioxide (top, in parts per million), of methane (middle, in parts per billion) and of nitrous protxyde (bottom, in parts per billion) since 1750.
Source: J. Chappellaz
- This “pollution”, causing an additionnal greenhouse effect, is global, exactly as the one in the MIT model,
- The induced climate change is susceptible to weaken the agricultural output, or to diminish the life expectancy of humanity (through diseases, aggravated droughts, and various other risks), exactely as the pollution of the model of the MIT was supposed to have this kind of effects,
- some very serious problems, like brutal transitions (for example a change of the oceanic circulation in the Northern Atlantic) could happen within a century, which represents time horizons that are consistent with those yielded by the model of the MIT,
- the less we have to fear a shortage of fossil fuels, and the more we have to fear climate change, exactely as the model predicts that not limiting natural resources “kills” the growth through pollution,
- etc…
Couldn’t one say, on the opposite, that the authors of this work have been particularly well inspired ? It is of course too soon to say so, but it is not too soon to say that ignoring the conclusions of this work is probably a mistake : during the past decades, it is not the non renewable resources that increased, but just our knowledge of them and the ability that we have to get to them. Just the same, it is not the limits of the world that have extended, allowing us to pollute without limitations, but just the fact that we have not reached them yet. The growth rate of the consumption of natural resources, in particular, slowed down because of the oil shocks of 1974 and 1991, what delays the ultimate exhaustion, but it does not change the essence of the problem, because we still look for perpetual growth. For the fossil fuels, for example, diminishing the annual growth rate of the consumption from 3% to 1,8% delays the final outcome by 20 years only.
More generally, saying that these people were wrong because so far everything went fine is a dangerous way to reason: let’s imagine someone that would jump from the top of the Eiffel tower, and that, passing by the first floor on his way to crashing on the street, would say: “I was damn right not to listen to all these prophets of doom that told me not to jump: you see, I did jump, and not only I am in perfect shape, but in addition I now have a fantastic wind in my hair that I didn’t have before”. What would we think of someone that would say such a thing ?
Results rudimentary for a complex world….but that would be much more relevant for climate change ?
Of course, the model used is very rudimentary: pollution is represented by a single variable, when there is one pollution by pollutant; there is no regional discrimination of demography or of resources that are not evenly allocated such as arable land; all non renewable natural resources are treated as a single one, assimilating tungstene ore and coal, which is debatable (!); consequences are not regionalized, etc. The limitations of computer power at the time probably explain part of some oversimplifications of this model: in 1970, the available computer power was not that of today !
However, if we apply this model to the “energy & climate” issue, where it is not totally absurd to have only one variable for pollution (it is then greenhouse gases emissions, a global pollution by nature), nor a single variable for the non renewable natural resources (that are then the fossil fuel ultimate reserves), how one cannot become very thoughtful in front of the results ?
In addition, as rudimentary as this model may be, it remains considerably more sophisticated than the tools used for the various “forecasts” that are used for public policies, most – if not all – of these forecasts being based on purely tendancial scenarios that do not include even one explicit limitation of any kind. It is notably the case for most “forecasts” regarding energy published by large bodies (government agencies, the International Energy Agency, etc), for which there is seldom the assumption that the neverending growth of their use might exert a negative feedback on the future consumption, as long as the cumulated consumption is compatible with the proven reserves (which is probably why not many “predictions” go beyond 20 or 30 years !).
It would be interesting to know whether there has been other attempts to model the evolution of the world since then, that could have been performed with a much increased computer power, and therefore a greater number of variables, an increased dataset regarding the past evolution of the world, and a better knowledge of the physicial limits for many processes. If the answer is yes, what did they yield ? If the answer is no, why didn’t anyone redo the experiment, given its obvious interest ?