How does work a windmill farm?
The power delivered by a wind turbine is highly variable with time. Indeed, such a turbine delivers its maximal power (also called its nominal power) in a restricted bracket of wind speeds: too slow, the wind does not drag the pales fast enough, too fast, it drags them too powerfully and it is necessary to reduce the rotation speed.
Here is an example below for a wind turbine of 175 kW of nominal power.
| Wind speed (m/s) | 8 | 10 | 12 | 14 | 16 | 18 | 20 | 22 |
|---|---|---|---|---|---|---|---|---|
| converted into km/h | 28,8 | 36 | 43,2 | 50,4 | 57,6 | 64,8 | 72 | 79,2 |
| converted into knots | 15,6 | 19,4 | 23,4 | 27,2 | 31,1 | 35 | 38,9 | 42,8 |
| converted in Beaufort units | 4 | 5 | 6 | 7 | 7 | 8 | 8 | 9 |
| Power delivered (kW) | 30 | 60 | 115 | 175 | 180 | 172 | 168 | 165 |
| % of installed capacity | 17% | 34% | 66% | 100% | 103% | 98% | 96% | 94% |
Here is, for another wind turbine (Jeumont 750 kW) the power delivered (in kW) depending on the wind speed (in meters per second).
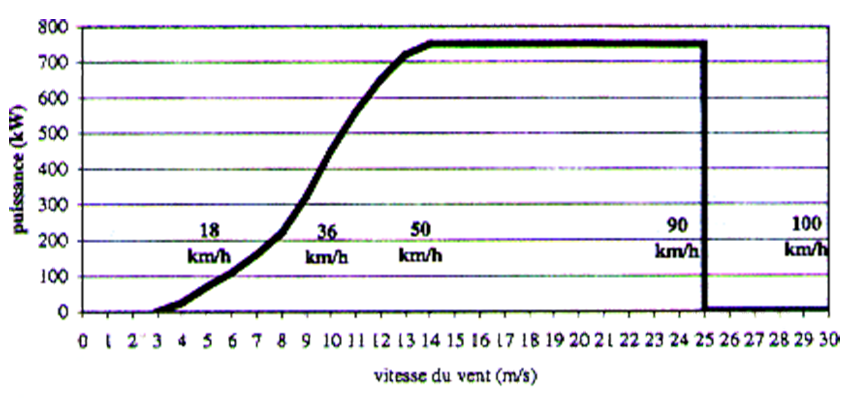
Power delivered (in kW, vertical axis) depending on the wind speed (horizontal axis, in m/s).
One will notice that the maximum power is obtained of a restricted brcket of values comprised between 14 and 25 m/s, or 50 and 90 km/h.
Modern wind turbines certainly have nominal powers that can go up to 2,5 MW on land, and 5 MW offshore, but this doesn’t change the law that links the power delivered to the speed of the wind. Also, though it will seem obvious to everyone, wind is constant neither in speed nor in direction (this influences the orientation of the line of windmills, that must be perpendicular to the main wind direction). Here are the examples of two compass cards for two places located on the shore, therefore pretty favourable a priori.
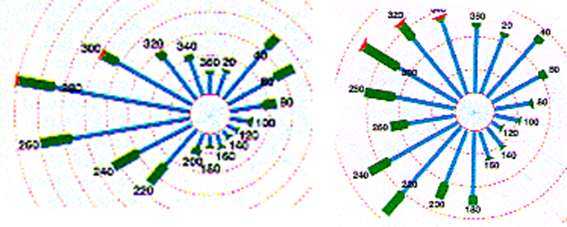
On the left: Distribution of the winds on the Island of Batz (Bretagne Nord).
On the right: Distribution of the winds at the Cap Camarrat (Southern coast).
Each graduated circle represents a given probability to have the wind blowing with a given speed . Starting from the center, each additionnal circle represents 2% of probability.
For example, on the island of Batz, the probability to have northerly wind (cap 360) is of 2% environ, and the probability of having westerly wind (+ or – 10°) is of 30% (14% for the 260° direction and 16% for the 280° direction).
Otherwise, the thickness and the colour of the line represent the Beaufort value:
- 1 to 4: blue;
- 5 to 7: green;
- 8 and 9: red;
- 10 and over: black.
At Batz, for example, the probability of having a wind of 4 Beaufort or below, and blowing from 240° is therefore of 6%; the probability of having a wind blowing from 240° and between 5 and 7 Beaufort is a little over 2%.
We immediatly see on these compass cards that the wind “turns” and that its speed is not regular. In particular the occurrences of wind blowing below à 8 m/s (4 Beaufort, blue line) are far from being negligible, and that winds of 7 Beaufort or over, which are necessary to get the full power of the above wind turbine, blows much less than 50% of the time.
As a consequence of winds that are seldom optimum, the power delivered is often far from the maximum possible, and most of all varies very quickly.
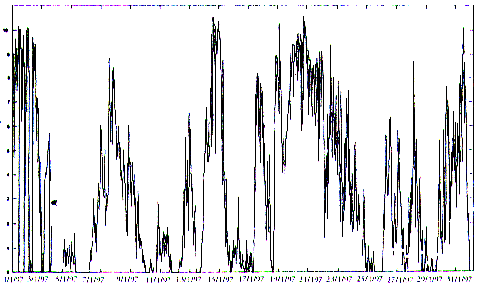
Average power over 10 minutes delivered by a “wind farm” of 10 MW of nominal capacity (located in the north of Great Britain), during january 1997.
Observations then show that to go grom the nominal power (in watts) to the energy produced during a whole year (in w.h), it is necessary to multiply by 2000 roughly, and not by 8,760 (the factor 8,760 represents 365 (days) x 24 (hours), and would be used for something producing at full power all the time).
In other word, the total energy supplied by a wind turbine is just as if it operated at full power for 2000 hours per year and yielded nothing the rest of the time.
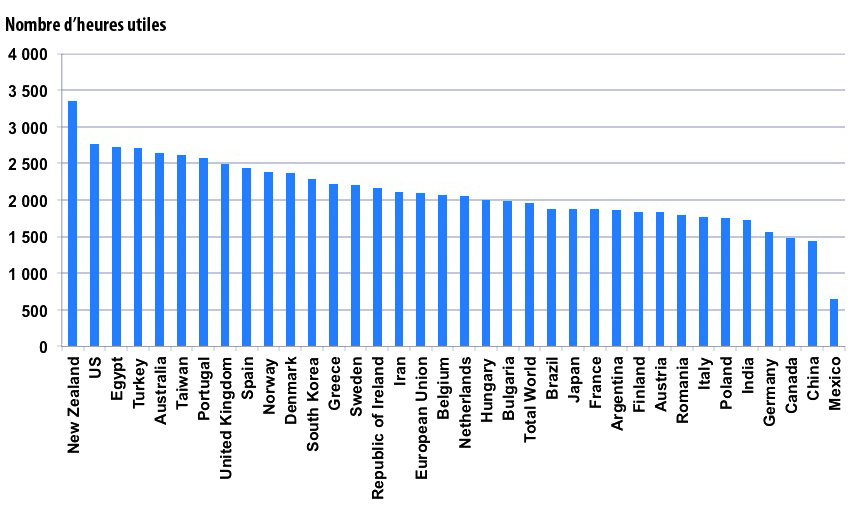
Load factor (= useful hours) to go grom the installed capacity to the annual production, for various countries.
Author’s calculations on data from BP Statistical Review, 2013.
(the installed capacity is at end 2012).
As the above table confirms it, a wind turbine of 1 MW of nominal power will produce on average – for the world – 2 GWh over a full year. Most of the installed power is onshore for the time being, and this multiplier is generally higher for offshore wind turbines.
Besides it has been noted that, for a field of wind machines, the energy delivered by surface unit of land is, in first approximation, independant from the size of the machines. Indeed, large and powerful windmills have to be spaced more, so that the wind remains efficient on all machines (because the air flow is perurbated just downstream of a wind turbine).
Practically, the density of installed power for a field of wind machines is roughly of 10 MW per km², so that the annual production, for a favourable zone, is about 20 GW.h per km², independantly of the size of the machines (actually it varies between 7 and 12 MW per km², so that 10 is an acceptable value ).
Is wind power an appropriate solution for supplying significant quantities of energy?
Starting from there, what surface should we cover with wind machines to produce the french electricity consumption? This is of course an “academic” calculation, but it will be useful to illustrate the potential of this way of “producing” electricity.
Energy production
The french electricity production is roughly a little above 550 TWh (1 TW.h = 1.000.000.000.000 W.h).
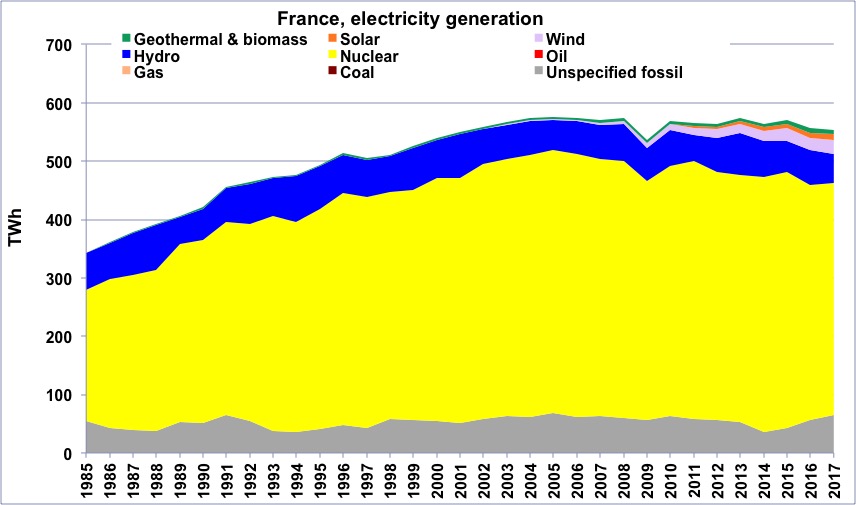
Electricity generation in France.
One we deduct transportation losses and exports, the domestic consumption ranges between 450 and 500 TWh.
Data from BP Statistical Review, 2013
In order to produce this amount (that is 500.000 GW.h) with windmills delivering 20 GW.h per km2, we should “plant” a surface of
500.000 ÷ 20 ≈ 25.000 km²
that is roughly 5% of the country, or the equivalent of the whole surface occupied by cities, roads and parking lots (see figures on urbanization), even if the required land is only partially mobilized and remains available for other uses (agriculture among others).
With machines of 1 MW of nominal power (that are about 80 m high), yielding roughly 2 GWh per year in a favourable zone, it would be necessary to install more than 250.000 to produce the above mentionned 506 TWh.
Energy storage
But as the wind is intermittent, when the demand is not wind dependant (nobody intends to have a fridge that doesn’t operate when there is no wind!), an electricity produced by wind only should be produced in excess then stored when there is wind, to be restituted when the consumer intends to be served. If the storage is done with “chemical” devices, we can use a battery or convert electricity into hydrogen, and if we use the means of mechanical energy, we can for example use water stored in altitude, in a dam lake.
If all the electricity production in France was wind generated, storage in batteries would probably be impossible to ensure: to store one week of electricity consumption (which is over1 TWh per day for the whole country), the country should have 7 tons of lead-acid batteries (these batteries can store 30 Wh per kg) per French person (lead-acid batteries are not precisely perfectly “clean” regarding the environmental impact of their manufacturing and their end of life…).
A probably more realistic solution would consist in producing hydrogen when there is wind (through electrolysis), then use it in fuel cells when there is no wind. The efficiency of electrolysis is 80% at best, that of storage is also 80% at best (there must be an energy spending to compress the hydrogen into a reservoir!), and then the best fuel cells have an efficiency of 80% in cogeneration (which means promoting electric heating, in a way!) but of 45% fort the sole electricity production.
In this last case, the efficiency of the whole storage chain is 28%. If we suppose that half of the electricity is used when it is produced, but that the other half has to be stored, with an efficiency of 25%, then we need roughly 600,000 windmills of 1 MW to produce 500 TWh (that is 125.000 machines that produce without storage, and 500.000 that produce with storage, hence, with an efficiency divided by 4, the total representing the equivalent of 250,000 machines without storage).
If we store through elevating water, here is a hint on the scale of what is required: in France, dams produce today 7% of the total electricity consumed (and represent 20% of the installed production power). It means that having enough water stored to supply the whole France when there is no wind requires to multiply dam lakes by 5 to 6 at least (so that dams alone can provide France with 100% of its peak consumption), then have the same surface of lakes downstream to recuperate the water after it is turbined to put it back in the upstram reservoir. We should also take into account the energy losses linked to the friction when elevating water back in upstream reservoirs (with the electricity delivered by wind turbines on windy days, which is roughly 25%).
Must we spend all this energy (no bad joke intended!) and this time (money is not the primary problem in my opinion, but time and energy of competent people is) in developping massively wind power, when, in the same time, a serious program of energy savings (such as insulating ancient housing, that would not cost more in public money) could allow to cut the energy consumption by 10% at least, on our way to dividing it by 2 to 3, which is the only solution to be “sustainable” otherwise than in speeches?
And….
Actually, the 2.000 factor mentionned above is exceptional: it is obtained in rare windy places (for example Belgium, Germany and Spain won’t reach it).
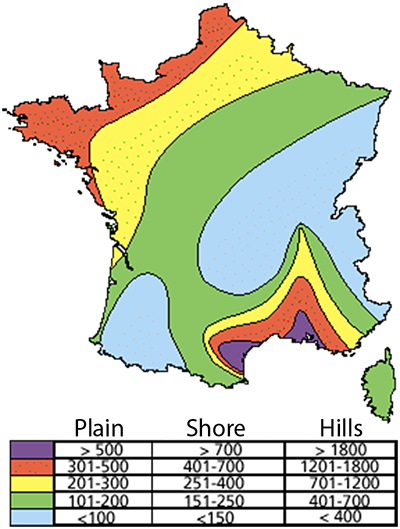
Average wind power depending on the zones, in watts for one m² of vertical surface placed at 50 m above the ground (perpendicularly to the wind, of course!).
Source : ADEME
In the facts it might be necessary to mobilize much more land: the company Espace Eolien Developpement has established a detailed map of the “technically feasible” potential for wind power in France (below), but this potential amounts to only10% of the 2000 electricity production.
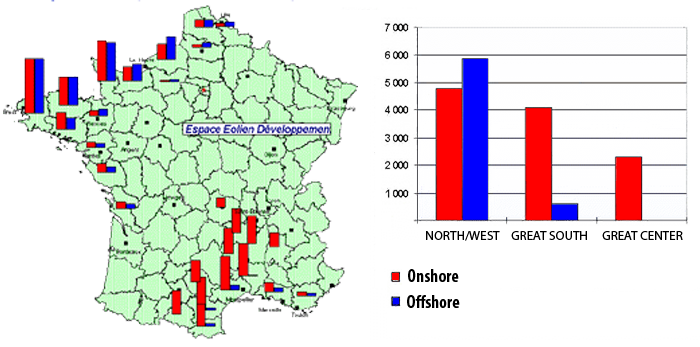
Map of the “technically feasible” potential for wind power in France in 1998.
A quick look at this map allows to realize that, just to get 10% of our electricity out of wind power, we should cover almost all the Cévennes, Bretagne and Normandie.
Source : Eolien Developpement
As the average wind speed decreases very fast when moving away from the most favourable zones (hill tops ofo shores), an average “load factor” of 1500 (which is still superior to what is observed in Belgium) and a 30% efficiency for storage would oblige to cover 20% of the country, with 1 million machines!
It is easy to deduct from the little above calculation that, in France, an ambitious objective regarding wind generated electricity (by ambitious one must understand “not ridiculous compared to our present energy consumption”) is not necessarily realistic, whatever the time horizon.
Denmark, the world champion regarding this means of production, generated a little over 10% of its electricity through wind in 1999. This represented a little over1% of its global energy consumption for the same year, and besides this country increased its energy consumption of 1% per year between 1990 and 1999, as it has been the case in France over the period 1960-2000.
Is wind power a solution to reduce greenhouse gases emissions?
Given the fact that solving the climate change problem requires to divide the world fossil fuel consumption by 2 at least, and, in the developped countries, by 4 to 12 (that is a diminution of 75% to 92%!), we can understand right away that substituting 1% or 2% of the fossil fuel consumption, moreover in an evergrowing world, doesn’t change much to the problem.
As we have seen that storing massive quantites of electricity is not possible, calling on wind power for amounts as significant as possible means, practically:
- that windmills are connected to the grid and deliver when there is wind,
- that, necessarily, another way of producing energy is used when there is no wind.
Let’s suppose that we wish to produce 25% of our electricity with windmills connected to the grid, which means that the installed capacity corresponds to the whole consumption of the country when there is enough wind (because of the 4 factor mentionned above). In fact we would produce 100% of our electricity when there is enough wind, but, on days without enough wind, we would have up to 25% electricity missing, or….we would produce it with “something else”. Except if the consumer accpets restrictions on days without wind (dispatched how?), it would impose to build also coal or gas or oil fired power plants that are used on windless days.
Indeed, nuclear power plants can’t adjust to fast daily variations, because when the chain reaction in a nuclear reactor is quickly halted – when the wind starts to blow for example – it is subject to a specific process called “xenon poisoning” that prevents to turn it on to full power again during the following hours. Besides, in France as in most european countries, dams are already at their maximum and building additional ones is not necessarily possible (in France for example the technicaly feasible potential is already built for 90%).
Assuming that our electricity consumption remains close to what it is today (in France), installing windmills to produce a large part of our electricity would mean building also a additional coal or gas fired power plants, with the same nominal capacity that the installed windmills. I heard recently an owner of coal fired power plants (the worst that can be done regarding greenhouse gases emissions) rejoicing of the development of windmills, that will “allow to give a new impulse to coal based electricity generation”!
In France, a massive investment in windmills connected to the grid will therefore mean an increase of the greenhouse gases emissions. On the other hand, for a country that already produces its electricity from coal or gas, there is a true benefit, but…provided that the coal or gas fired power plants are kept (this is the case of Germany and Denmark, this explaining that). Swithing to nuclear – that has also inconvenients, but that doesn’t have only inconvenients! – can allow to save much more on greenhouse gases emissions.
Actually we already have a couple of coal fired power plants in France, that could be stopped when there is wind, that is 25 to 30% of the time at most, but the benefit stops there. As our production out of these plants equals to 30 to 40 TWh, we can install windmills to obtain 10 TWh at most, that is a couple % of our electric production. Let’s note that building one or two large dams could enable to get the same electricity production, and anybody is free to decide whether one prefers a valley under water or hills and shores packed up with windmills.
As a conclusion…
The present infatuation for wind power in Europe is curious. This solution doesn’t appear to have any significant potential to enable a large decrease of greenhouse gases emissions or to provide a significant supply for our present energy consumption.
If the first priority for the future is to lower the greenhouse gases emissions, there are much more efficient acts to perform than to install windmills everywhere. Switzerland, that doesn’t have many windmills, has emissions per capita that are 50% lower than that of Denmark (that is the first greenhouse gases emitter per capita in the european community, Luxemburg excepted), though it is cold in the winter (30% of the energy consumption in France is linked to heating and sanitary hot water). Germany, that ranks second just after Denmark for wind generated electricity (in absolute figures) has greenhouse gases emissions per capita much over the european average.
More genrally, if our first objective is to minimize our impact on the environment, thinking that putting wind machines everywhere is enough is alas a dream. To get there, we must give up our desire for perpetual growth.
If our first priority is to call only on renewables, it is then non negociable to previously cut our energy consumption by a factor two to three: no solution based only on renewables is of the appropriate magnitude to satisfy our present energy consumption, and by very far.
And all renewables are not equal ! Considering that biomass, biofuels, wind power, solar, geothermals and hydroelectricity could all contribute the same is ignoring that each one has its own advantages and inconvenients, and that their potentials are far from being equal. As long as we keep our present energy consumption, wind power will just be an alibi, adding infrastructure for a marginal benefit and, in certain cases, leading to an increase of greenhouse emissions. Hum…..