What is a “fair price” for electricity ? Anything between zero and 50 cents (of euro) per kWh, or even more. Whoever argues that a fair price would be so much and nothing else actually gives the result of a calculation that goes with a long (and sometimes boring) list of assumptions. When the calculation was not done by the defender of a given price, which is of course very common, then what he (she) actually does is advocating precise assumptions, some of them very bold, but generally without being conscious of it. Can we try to understand what the various assumptions used to come to a given price actually imply?
What is “producing” electricity exactly? Seen from a physical point of view, this expression describes something very simple: it means transforming a primary energy, that is one found in the environment (matter that burns, water that falls, etc) in both electricity on one side, and “losses” on the other. The latter correspond to the fraction of the incoming energy which goes out of the plant as useless heat.
Most of the time, it is excess heat evacuated by a cooling system, but it can also be heat lost in fumes (it is the case in coal, gas or oil fired power plants), in friction (in dams or in wind turbines), in heat emitted by the generator (for photovoltaic panels), etc.
In 2011, 85% of the world electricity generation began with boiling water. Indeed, all power plants that use coal, gas, oil or nuclear fuel first produce huge amounts of heat (in a boiler or in a reactor), used to generate steam that will put in motion a turbine, then an alternator (through the turbine). The only power plants that use a fossil fuel and do not have a steam cycle are combustion turbines, which are a kind of jet engines fixed to the ground, in which combustion gases directely feed a turbine (as in a place). They have a poor yield and are used a couple hundred hours per year, during peak consumption.
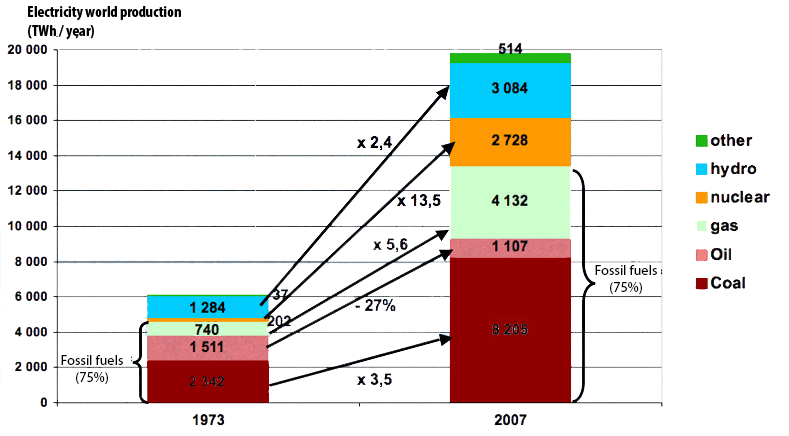
Breakdown by primary energy of the world electricity production in 1973 and 2007.
Coal has been representing 40% of the total for numerous decades. “Other” includes waste burning, biomass, wind, solar, geothermal, wave and tidal, etc.
Source : AIE, key energy statistics, 2009.
When the heat is lost, these plants have a yield that varies between 20% – for a combustion turbine, or a very old and very poor coal power plant – and 55% for the best gas fired power plants (with a combined cycle: the plant uses both the heat to generate steam – that operates a steam turbine – and the fumes – that include only nitrogen, CO2 and water vapour, thus nothing corrosive – to operate a regular turbine). Without a combined cycle, the yield can go up to 45%, which is the upper limit for a recent coal unit. When looking at the installed base, the average yield for coal power plants in the world is around 33%, and the figure for nuclear is about the same.
When the heat is valorized, it is co-generation. The yield of the unit is then obtained by adding what goes out as electricity, and what goes out as useful heat (for example in urban heating) divided by the ingoing energy. It’s only when heat is used that the global yield can rise up to 80% (the rest is lost in fumes and friction). Such a cogeneration can be done with all thermal plants, including nuclear ones.
To “produce” electricity, we therefore need:
- an energy conversion unit, named “power plant”
- an incoming energy: coal, gas, oil, something fissile (nuclear), a waterfall, wind, sun rays, ground heat (geothermal), or any other energy available in the environment,
- a system to manage unwanted byproducts (ashes, fumes, radioactive waste, etc),
- and a grid to evacuate and distribute the electricity generated.
- A power plant is therefore never independent of a larger system to which it belongs, and that include industries that supply primary energies (coal, oil and gas industries, uranium mining, etc), a grid able to dispatch the electricity produced (which is the same with a gas or a nuclear power plant!), and that allows to constantly match the demand for power and the supply of power, because electricity, by definition (it consists in electrons moving in a conducting material), cannot be stored as such.
The system also requires industrial sectors to conceive, manufacture and maintain all the plants, regulations of all kind (on the maximum temperature of rejected cooling water, on the minimum flow that dams must allow in the summer, on the minimum or maximum number of turbines in a single place, etc) and people to enforce them… and of course all this will have an economic counterpart!
Let’s talk money for primary energy
Actually, this section will begin with… what is costless to all of us, but essential to everyone! It is… the existence of primary energy. Indeed, no one on Earth has ever spent a single cent for the formation of oil or coal, for the presence of mountains and the existence of a water cycle (that allow hydroelectricity), for the existence of fissile atoms in the Earth crust, or for the existence of wind or sun rays. Supporters of “green energies” like to recall that wind and sun are free, but oil is equally free! In both cases, nobody ever paid anything to allow for their existence on our planet.
What is not free, whichever energy we are looking at, is the money given to the various people that extract from the environment a kWh that was already there, in the form of oil or wind, or that have been lucky enough to sit on some energy resource they did not create, and that get paid to let go part of it. More generally, in our economic system, the price of any object – including a barrel of oil – is only a pile of salaries and rents given to men that extract and transform natural resources, that are all free.
If the existence of a primary energy is free for everyone, making it available for a power plant will cost all the work associated to its extraction and transportation. As a result:
- steam coal (used in power plants) is worth 30 to 150 dollars per tonne, what includes:
- human labor to extract and wash coal, which amounts to 15 per 35 dollars per tonne,
- transportation to the power plant, which can be worth zero (when the plant is located right by the mine, which is frequent) and up to 60/70 dollars per tonne when there is a significant distance by train. With only maritime transportation (plant located in a harbour) it is around 10 dollars per tonne,
- and the rent paid to the owner of the resource, or to the trader, who pockets in both cases the diffrence between the market price and the production and transportation costs.30 to 150 dollars per tonne of steam coal, it means 3,5 to 17 euros per MWh of coal (beware! It is per Mwh of heat coming from bruning coal, not per electric MWh). With an average yield of 33% for the plant, it means that coal will represent 10 to 50 euros per electric MWh leaving the plant (which is not the price for the end consume, that will be discussed below). Let’s remind that one MWh is 1000 kWh.
- gas has a very different price depending on the continent, because gas is a regional energy:
- in all cases it is necessary to pay the extraction – and purification – cost, which varies between 1 and 15 euros per MWh, depending on the local conditions (quality of gas, construction cost of the infrastructure, flow rate, etc),
- it is also necessary to pay for transportation, that also varies between 1,5 and 15 euros per MWh,
- and just as for coal, there are also rents paid to the owner of the gas fields and the various traders.All components included, the market price of gas varies between 6 euros per MWh (in 2012 in the US) and 40 to 50 euros (imported LNG in Japan in 2012). With a 45% yield in the power plant, it means that gas accounts for 15 to 110 euros per electric MWh leaving the plant.
- For oil, that only accounts for 5% of the world electricity production:
- we will find again the extraction cost, between 2 and 60 dollars per baril, that is 1 to 30 euros per thermal MWh (1 euro is for old giant fields of the Middle East, and 30 for the technically complicated fields located in places you wouldn’t go to),
- transportation has also to be paid, but it is only one euro par MWh,
- refining has to be included, because a power plant doesn’t burn crude oil, mais heavy fuel oil, and refining costs a couple dollars per barrel, that is 2 euros per MWh,
- but as for other energies (and maybe even more) there are rents paid to owners of fields and middlemen that trade this black gold.A MWh of oil is therefore worth 10 euros when the barrel is worth 20 dollars (what has been the case for most of the 20st century), and 50 euros when the barrel climbs to 100 dollars. But… again, power plants buy heavy fuel oil, that is sold with a distinctive price, and was worth around 700 dollars per tonne in 2012, or… a little above 50 euros per MWh. With a 35-40% average yield of a power plant, it means that heavy fuel oil will represent 30 to 150 euros per electric MWh leaving the plant (which explains why the power plants are generally fired only during peak hours, when the market price of electricity is high enough).
- Now let’s shift to nuclear. If companies are different, the principles remain the same:
- the first component is again the extraction and purification cost of the ore, to obtain rather pure uranium oxide,
- transportation cost in negligible, because natural uranium can be manipulated bare hands and one kg of uranium enables to get as much heat – through the fission of the 235 isotope – as 7 tonnes of oil).
- and then rents have also to be paid to mine owners and traders.Uranium is sold 15 to 50 dollars per pound of oxide (U3O8), that is 40 to 130 dollars per kg of uranium. One kg of natural uranium will yield 6 grams of the fissile isotope U235, that will produce around 70 MWh of heat. The market price of uranium will therefore represent 0,5 to 1,5 euro per MWh of heat, and 1,5 to 5 euros per electric MWh leaving the plant (average yield = 33%). But most nuclear power plants use enriched uranium, and the full fuel cycle (enrichment, manufacturing of rods, etc) leads to doubling the price of uranium. At the end, the full fuel cycle (mining included) represents 3 to 10 euros per electric MWh leaving the plant.Nuclear energy also requires some special waste management, but the corresponding cost is not included into the primary energy supply, and is discussed below (nuclear energy is not the only case in which there is some special waste management in a power plant).
For all the other sources excluding wood (hydroelectricity, wind, solar, etc), it is not possible to distinguish between the primary energy supply and the transformation process, because the plant is right where the energy supply is (the dam is on the waterfall, the wind turbine in the wind, the geothermal unit on top of a source of heat, etc).
If we summarize what has been discussed above, we get the following:
| Coal | Gas | Oil | Nuclear | Others | |
|---|---|---|---|---|---|
| Fuel cost, euros per MWh of incoming fuel (historical minimum) | 3,5 | 6 | 10 | 1 | 0 |
| Fuel cost, euros par MWh of incoming fuel (historical maximum) | 17 | 50 | 50 | 3 | 0 |
| Typical yield of a power plant (existing plants) | 33% | 45% | 35% | 33% | Variable |
| Fuel cost, euros per electrical MWh (historical minimum) | 10 | 13 | 30 | 3 | 0 |
| Fuel cost, euros per electrical MWh (historical maximum) | 50 | 110 | 150 | 10 | 0 |
NB: the above costs are of course for the past! In the future it might be different… and we will come to it later.
Let’s talk money for building the plant
After an available primary energy, there is another thing we need: a conversion unit (from primary energy to electricity), that we call a power plant. This thing has to be built (which costs a leg) and be operated afterwards (add an arm). Before going any further, let’s underline a little something regarding units which nevertheless sometimes occasionates (very) big mistakes. For energy, produced or consumed, we use… energy units. The physicist will use joules, but depending on the country and who is talking you may find kWh (3,6 million joules), British Thermal Units (1059 joules…), tonnes oil equivalent (roughly 42 billion joules), or barrels oil equivalent (5,72 billion joules, pardon me!).
But for power plants the first unit used pertains to power, because construction costs depend on power and not on output. And, to be precise, the power of a plant – sometimes called its nominal power, or also its installed capacity – is its maximal electrical output (but it can be operated at lower levels). Here are a couple of examples:
- a typical coal unit will range from several tens of MW (megawatts, a million of watts) to 1000 MW (of electricity generated), and it is about the same for a gas or a heavy fuel oil unit. A single plant can host several units (there is generally one chimney per unit), and of course the total power is that of all the units,
- a dam has a nominal power that can be anywhere between several kW (1 kW = 1000 watts) and several GW (1 GW = a billion of watts = 1000 MW = 1000000 kW) depending whether it is a small installation on a small river (no bigger than a mill) or a major dam in the mountains (the Three Gorges dam, in China, has a power of 16 GW),
- a nuclear reactor is several hundred MW to more than 1 GW (the EPR is 1,6 GW), and as for coal it is possible (and generally the case) to have several reactors in a single plant,
- units producing electricity from waste – or from methane produced with biomass – seldom allow more than several tens of MW, which is also the figure for geothermal units,
- with wind turbines we loss an order of magnitude: the typical power of such a device is several MW. Wind turbines are often gathered in “fields”, that include several to several tens of machines,
- with photovoltaic panels, we loose 3 orders or magnitude, and a single device will have a nominal power of several kW. But here also we can have “fields” for which the total output can go up to several hundred MW,
- there are also more “exotic” device, such as concentration solar, tidal, wave power, with nominal powers that range from several kW so several hundred MW.
| Hydro | Coal | Gas | Nuclear | Onshore wind | Offshore wind | Photovoltaic | |
|---|---|---|---|---|---|---|---|
| Cost (€ per kW of installed capacity) | 600 - 5000 | 1000 - 2000 | 500 - 1000 | 3000 - 4000 | ≈1000 | 3000 - 4000 | 1500 - 4000 |
| Amount for 500 MW (Billion euro) | 0,3 - 2,5 | 0,5 - 1 | 0,25 - 0,5 | 1,5 -2 | ≈ 0,5 | 1,5 - 2 | 0,75 - 2 |
This table gives some central values for standard units.
Construction costs are always given per kW of nominal power.
The lowest price tag per installed kW is for gas, then for coal, then hydro and nuclear. Wind is apparently not very costly, but as the load factor is lower than what it is for gas or coal (the fraction of the time during which the turbine is producing electricity), the contribution per kWh is higher; we will discuss that below.
As the utility seldom builds himself the power plant that it will operate, the values above correspond to what will be paid by the power company (typically EDF, or RWE, or Iberdrola) to the company that builds the power plant (typically Siemens, or Alstom, or General Electric, or Mitsubishi, or Areva, etc). But to get the share of the construction cost in a kWh, it is not as simple as dividing the construction cost by the cumulated production of the plant over its lifetime. Some finance is also around, as we will see!
Let’s talk discounting
Our power company has therefore paid “cash” (even though it had to borrow that money) the construction cost to the manufacturer of the plant. On the other hand, revenues will only be cashed in according to the kWh that will be produced in the future, as long as the plant is able to operate (and the power company makes calculations with the nominal lifetime of the plant).
How can the power company link what has been paid for the construction of the plant to the selling price of a kWh? First, it will divide the construction cost by the lifetime of the plant, and this gives the amount that has to be amortized each year into its balance sheet. But that’s not what is taken into account to calculate the production cost of a kWh. The power company will also consider that if the money had not been spent into the construction of the plant, it would have been put “elsewhere” and would have yielded profits (like interests).
So for the economic calculations, the power company will do as if it had borrowed all the money necessary to build the plant, and each year the share not amortized bears interests that are included into the spendings. Actually if the money has not been borrowed, these interests will most probably have to be paid also…. to the investor that gave the money, in the form of dividends. The interest rate used for the calculation is called a discount rate.
How much is it worth? Well, it all depends. In the first place, it depends on whether the money has indeed been borrowed or not. If the power company has really borrowed the money (from a bank or on financial markets), this discount rate will be at least the interest rate. If the power company got the money otherwise (with its past benefits, through a capital increase, etc), this discount rate depends on the expectations of the people that provided the money (for example the expectations of dividends or value increase of the shareholders).
In any case, this discount rate is linked to the “growth potential” of the economic system. Indeed, if everyone expects a strong economic growth, then we will all consider that any investment is going to be profitable, and that will push the discount rate up. On the other hand, when money is abundant – for example through savings – and the econoomy in recession, rates are generally lower.
But, alas, a discount rate can never be defined by a rigorous law. It can only be approached by experience, through asking an economic agent whether he prefers to have 100 right now or 100+x in a year. For x = 0, very few people will wait, and if x = +∞, everybody will do so. And for each agent, there is value of x, “somewhere” between 0 and ∞, for which the agent will answer that the two possibilities are indifferent. We then have the empirical value of the discount rate for this agent.
Different categories of agents generally use different brackets for this discount rate. Public bodies, that are supposed to be in charge of our long term interests, use low discount rates (0 to 5%), then industrial companies use higher rates (5% to 10%), then the financial world uses even higher rates (up to 15%, even 20% sometimes), and at last individuals (like you and me) sometimes act with discount rates as high as 30%!
Why has it been necessary to spend so much time discussing discount rates? Because, when you face businesses that ask for very high initial investments, which is the case for electricity production, the value chosen for the discount rate is central for the minimum selling price of electricit
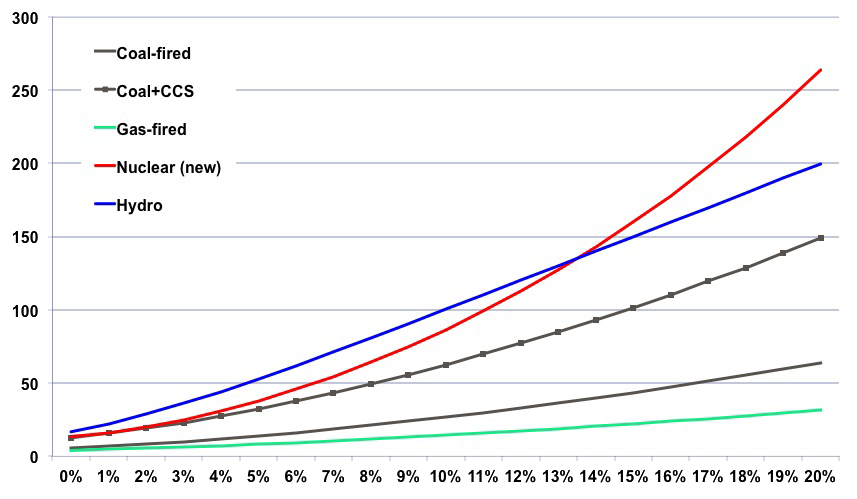
Share of the production cost per electrical MWh (1MWh = 1000 kWh) coming from the initial investment, depending on the discount rate used by the producer.
Beware: these figures do not give the full production cost per MWh, but just the share coming from the initial investment, depending on the discount rate chosen. One must add operating costs – and other things that we will see below – to get the full price. The other hypotheses used for the calculation are detailed below.
| Coal | Coal & CSS | Gas combined cycle | Nuclear 3G | Hydro | |
|---|---|---|---|---|---|
| Lifetime | 40 years | 40 years | 30 years | 60 years | 60 years |
| Load factor | 80% | 80% | 80% | 80% | 40% |
| Investment | 1500 €/kW | 3500 €/kW | 814 €/kW | 4000 €/kW | 3500 €/kW |
| Yield | 40% | 30% | 55% | 35% | - |
The graph above shows that the share coming from the initial investment is tremendously dependent from this discount rate. As no operator wishes to sell below its production costs, the above curves give the minimum selling price in euros per MWh depending on the type of plant and discount rate. Example: for a newbuilt dam, with a lifetime of 60 years, a 40% load factor and a construction cost of 3500 euros per kW, the MWh must be sold at least at 20 euros if borrowing money costs nothing (discount rate = 0), and at least 100 euros if the discount rate is 10%.
Of course, on top of that we must also add the cost of primary energy (nil in case of a dam, but very significant for gas or coal), and other expenses (salaries, maintenance, license fees, etc), so that what we have above is not – again – a production cost, but the share of that cost coming from the investment. It is easy to see that the production mode with the lower investment cost is gas, then coal, and that the two centralized carbon-free modes (nuclear and hydro) are also the most capital intensive (we will come back to this point below).
Besides, some plants are long to build, which creates a period during which capital has to be mobilized with no revenues. The table below gives average values for the most common modes.
| Hydro | Coal | Gas | Nuclear | Onshore wind | Offshore wind | Photovoltaic | |
|---|---|---|---|---|---|---|---|
| Construction time | 1 to 10 years | 4 to 5 years | 3 to 4 years | 7 to years | 1 years | 1 to 3 years | < 1 years |
Let’s talk about load factors
In the elements that are central to calculate the production cost of electricity, there is also the load factor of the production unit. Indeed, no power plant operates at full power 24 hours a day and 365 days a year. There are many reasons: the demand is not constant, all units have to be stopped for maintenance, the fuel only is sometimes more expensive than the market price of electricity, or the primary energy is not available (wind, waterfall…).
In practical, to go from the installed capacity (in kW) to the energy produced in a year (in kWh), we need the number of useful hours, which represent the number of hours in the year during which the plant should operate at full power to produce the electricity effectively produced at the end of the year. We can therefore write:
Annual electrical output in MWh = installed capacity in MW × number of useful hours
The number of useful hours is at most 8760 (that is 24 hours per day * 365 days per year). But, as mentionned above, it is always below, either because the plant operates below full power (because the demand is not always at its maximum), or because the cost of the fuel (coal, gas, heavy fuel oil) is over the market price of electricity, or because the primary energy is not there, as for:
- dams (the annual precipitations in the watershed are not sufficient to allow a production at full power all year round)
- solar (obviously there is no light at night)
- wind (whichis not blowing at its maximum all the time)
In the facts, the number of useful hours ranges from 2500 to 6000 for dams, 1000 to 2000 (more on rare occasions) for photovoltaic, 1000 to 8000 for fossil fuels, 7000 to 8000 for nuclear, 1500 to 3000 for wind (more on rare occasions). Instead of useful hours, many people prefer to use “load factors”, which represent the percentage by which the total number of hours in a year (that is 8760) should be multiplied to get useful hours. The simple equation the becomes:
Annual electrical output in MWh = installed capacity in MW × 8760 × load factor (in %)
This way, a 20% load factor corresponds to 8760*20% ≈ 1750 useful hours, and it means that the annual output would be obtained with the plant operating at full power 20% of the time and nothing the rest of the year. The table below gives brackets of standard load factors for various plants.
| Hydro (dam) | Hydro (run of river) | Coal | Gas | Nuclear | Onshore wind | Offshore wind | Photovoltaic | |
|---|---|---|---|---|---|---|---|---|
| Load factor | 30% to 50% | 80% to 100% | 50% to 80% | 50% to 80% | 70% to 90% | 15% to 25% | 30% to 40% | 10% to 25% |
This load factor modulates the contribution of the initial investment: the lower it is, the higher the share of the initial investment. A first way to realize it is to calculate the investment per “efficient kW”. Efficient kW correspond to the power that should be installed if the plant operated 8760 hours a year. It evolves as the reverse of the load factor: for a load factor of 40%, the efficicent power corresponds to the effective power divided by 2,5. For a load factor of 10%, the efficicent power corresponds to the effective power divided by 10.
Calculating efficient kW means dividing the investment cost per kW by the average load factor, and it gives the real contribution of the investment to the production cost. The table below gives a range of values.
| Hydro (dam) | Hydro (run of river) | Coal | Gas | Nuclear | Onshore wind | Offshore wind | Photovoltaic | |
|---|---|---|---|---|---|---|---|---|
| Cost (€ per installed kW) | 3 500 | 3 500 | 1 500 | 800 | 4 000 | 1 000 | 4 000 | 2 000 |
| Average load factor | 40% | 80% | 80% | 50% | 80% | 20% | 40% | 15% |
| Cost (€ per efficient kW) | 8 500 | 4 200 | 1 700 | 1 600 | 5 000 | 5 000 | 10 000 | 13 000 |
The above figures allow to compare the contribution of the initial investment in the production cost of a kWh (since all has been levelled with a same operating time). If the only question is the amount of capital to obtain a kWh, then investors, who are limited in capital before anything else, will prefer gas (even though it emits CO2), than coal (with even more CO2), then hydro (in emerging countries the construction costof dams is three times lower to what it is in OECD countries, so hydro remains a preferred choice), and nuclear will come last.
Wind and photovoltaic end up with high amounts per efficicent kW, though the construction cost per installed kW is not that high, but their load factors are pretty low. For photovoltaic, construction costs should be divided by 10 to allow for an initial investment per kWh comparable to what it is for gas (without mentionning the cost of managing an intermittent and fatal source delivering low voltage power and not high voltage power).
Let’s talk about pollution
As converting a primary energy into electricity is a particular type of transformation, it will, as with any transformation, produce unwanted effects and by-products. Indeed, there is nothing such as “clean” electricity: it’s always “the dose that makes the poison”. But each and every mode has its own inconvenients:
- coal fired power plants produce fine particles, various pollutants in the fumes (SO2, NOx), emissions of trace elements (mercury, arsenic, fluoride, and more), ashes, cause mine accidents and diseases of miners, heat up rivers (which is the case for all thermal modes cooled with river water), not mentionning that coal produces the most CO2 per kWh. Wow!
- gas fired power plants also produce NOx, induce some accidents upstream in gas production, heat up rivers as the case may be, and of course also produce CO2, and thus climate change thereafter,
- oil fired power plants also produce NOx, SO2, fine particules again, induce some accidents upstream in oil production, heat up rivers as the case may be, and CO2 again.
- large dams can cause large accidents when they brake up (with tens of thousands of casualties around the world, including in Europe), disrupt river flows and cause damage to freshwater species, and, in the case of tropical dams, can cause methane emissions (methane is a greenhouse gas),
- nuclear power plants can cause accidents, rare and with less effects on men and the environment than claimed by the (French at least) medias, but nevertheless spectacular and potentially costly, produce special waste, heat up rivers as the case may be, induce – rarely – some accidents in the upstream mining operations (but nothing comparable to coal),
- wind and photovoltaic produce little unwanted effects on the environment… as long as they remain very small contributors! But if these modes were to develop massively, significant inconvenients would also appear:
- as wind turbines slow down the wind (it is the name of the game, to transfer energy from moving air to moving electrons!) they slow down atmospheric convection. As long as wind represents a small fraction of our energy supply it is not a problem, but researchers from the MIT have calculated – the paper can be downloaded here – that if 10% of the 2100 world energy supply were to come from wind (in 2011 the fraction is 0,6%), the surface temperature of places with plenty of wind turbines could increase by an additional 1°C, that would come on top of what global warming will bring anyway,
- wind produces electricity when the wind blows and not necessarily when the end consumer presses the button. Therefore a full system has to include a way to produce alectricity some other way when there is not enough wind, or store it. If managing this problem is done with plenty of batteries, the associated pollution must be taken into account when considering the whole chain allowing to produce and deliver electricity (as for the other modes). If the backing of wind means building up or keeping gas fired or coal fired power plants, then the inconvenients of gas and coal should be partly affected to wind. If it means building pump stations, then the inconvenients of building dams or equivalent should be partly supported by wind, etc.
- manufacturing solar panels is very much alike manufacturing electronic products. As long as photovoltaic produces 0,1% – in 2011 – of the world energy supply we do not have an issue, but if the supply was to be multiplied by several hundred these inconvenients might become a true subject of concern. Let’s remember that a multiplication by 100 our oil consumption changed its inconvenients from minor to major!
In the smart talk of economists, all these inconvenients that happen “elsewhere and/or later”, and that will induce costs or damages to “somebody else” (than the operator of the power plant, of course) are called externalities. For example, professional diseases of coal miners induce expenses – treatments for the miners, pensions for the widows – and these expenses are not necessarily paid for by the mine owner. In such a case the corresponding costs are not part of the price of coal, and no more part of the production cost of electricity coming from coal. One of the externalities that electricity producers do not pay is the future damage of climate change, and we will come back to it below.
Of course what the plant operator pays for real (for example a device to avoir emitting sulfur dioxide) is included in the production cost.
Let’s perform a first sub-total
Here we are, with industries that extract and transport gas, coal, oil or fissile atoms, and a power plant that has cost so much. At the end of the day, how much for a MWh coming out of the plant? (which is not the price for the end consumer). At this point my dear reader will have understood that the good answer is… It depends:
- on the discount rate, particularly for nuclear and hydro
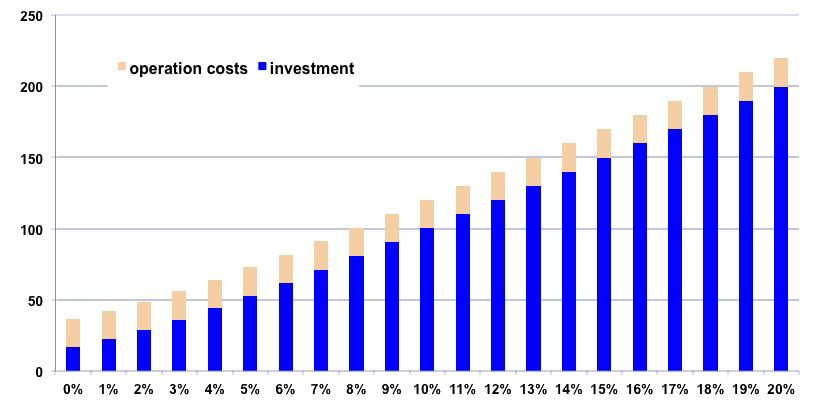
Production cost – in euros – for one MWh coming from a dam, depending on the discount rate (horizontal axis).
The other hypotheses are a 40% load factor, 3500 euros per installed kW, 60 years lifetime, and operating expenses of 70 euros per kW and per year.
With a 2% discount rate, one MWh costs a little less than 50 euros, for a device than can produce peak electricity, which is pretty cheap. With a 4% discount rate the production cost is 65 euros per MWh, which is still pretty cheap for peak power. But if this discount rate jumps to 12% (the “norm” in the financial world), then the production cost jumps to 140 euros per MWh. An expensive dam is a dam in the stock market!
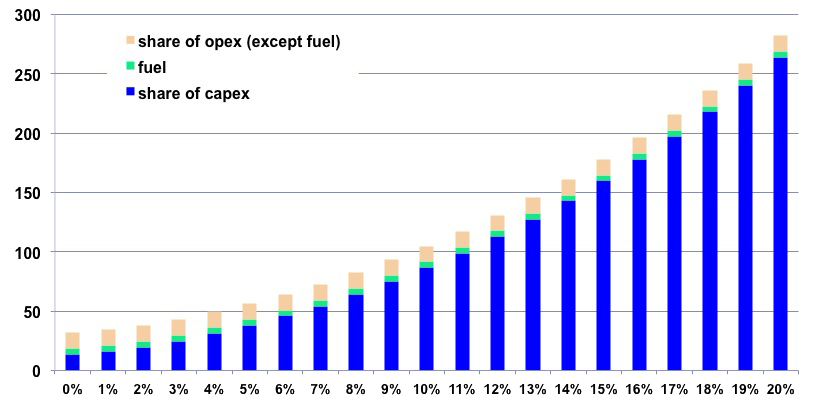
Production cost – in euros – for one MWh coming from a nuclear power plant (EPR type), depending on the discount rate (horizontal axis).
The other hypotheses are a 80% load factor, 4000 euros per installed kW, 60 years lifetime, 5 euros of fuel cost per MWh, and other operating expenses of 100 euros per kW and per year.
With a 2% discount rate, one MWh costs 37 euros, not including a provision to cover the risk of accident (that would amount to a couple euros per MWh, see below). With a 4% discount rate the production cost is still below 50 euros per MWh, which is still pretty cheap for CO2 free baseload electricity. But if this discount rate jumps to 12%, then the production cost jumps to 120 euros per MWh. Again, an expensive nulcear reactor is is a reactor in the stock market!
One will also notice that, for hydro as for nuclear, the operating expenses represent roughly 20 euros per MWh (for nuclear it includes waste management). It means that the longer these plants can live, and the more “cheap MWh” we can get. When the plant is amortized (and therefore the capital cost disappears), the production cost is equal to the operating expenses, and then these modes allow to have MWh that cost less that just the cost of fuel in coal and gas fired plants.
Replacing an amortized nuclear power plant (aged over 40 years) by a new one, instead of prolongating the “old” one, induces an additional expense of at least 5 billion euros per EPR equivalent, if the discount rate is zero (1,5 GW of power × 90% load factor × 8760 hours in the year × 20 euros of capital cost per MWh × 20 years).
- on the cost of fuel, which is particularly sensible for coal and gas (and of course also oil)
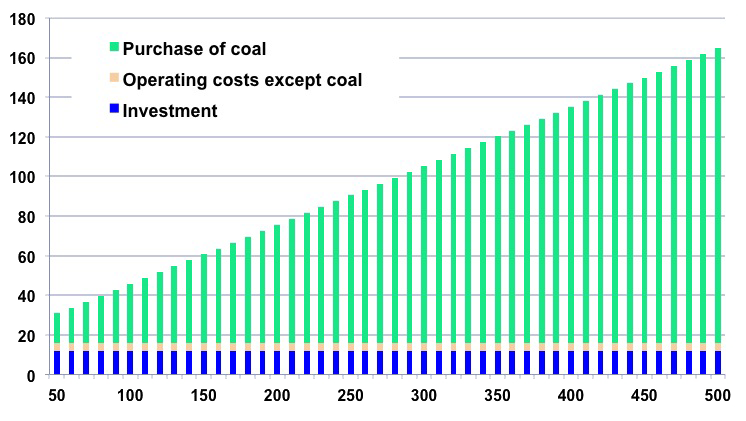
Production costs – in euros per MWh – for a coal power plant, depending on the price per tonne of coal, in dollars (50 to 500 dollars).
When coal is worth 500 dollars per tonne, it means 71 dollars per thermal MWh of coal (71 dollars per thermal MWh for oil means 115 dollars per barrel). When coal is priced 100 dollars per tonne, the thermal MWh is worth the same than with a barrel of oil at 20 dollars (cheap!).
The rest of the hypotheses are a load factor of 80%, 1500 euros per installed kW, a lifetime of 40 years, a 4% discount rate, operating costs except fuel that amount to 2% of the initial investment, and a 40% yield. When coal is worth 50 dollars per tonne, the purchase of fuel represents half of the production cost; if coal jumps to 120 dollars per tonne (average price in 2011), the fuel cost represents 70% of the production cost (the other hypotheses are similar).
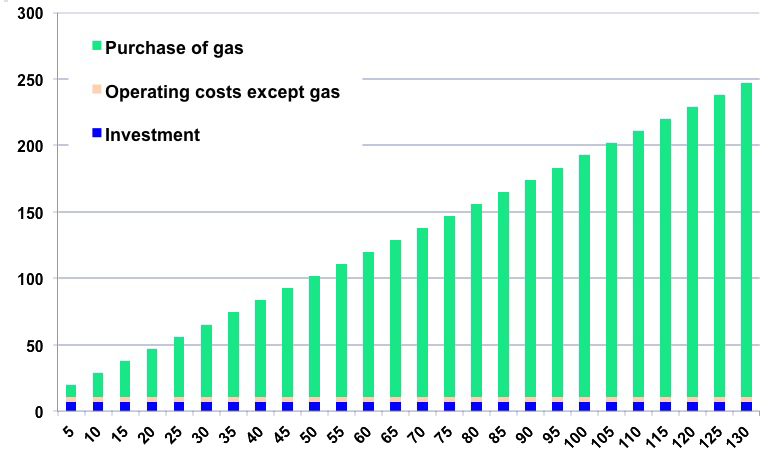
Production costs – in euros per MWh – for a gas power plant, depending on the price of gas, in euros per thermal MWh (5 to 110 euros).
At 70 euros per thermal MWh, gas is equivalent to oil at 110 dollars per barrel (with the exchange rate of 2012).
The rest of the hypotheses are a load factor of 80%, 800 euros per installed kW, a lifetime of 30 years, a 4% discount rate, operating costs except fuel that amount to 3% of the initial investment, and a 55% yield.
- of the “cost of CO2” (it has to be a cost for all the electricity produced, and not only for part of the quotas allocated)
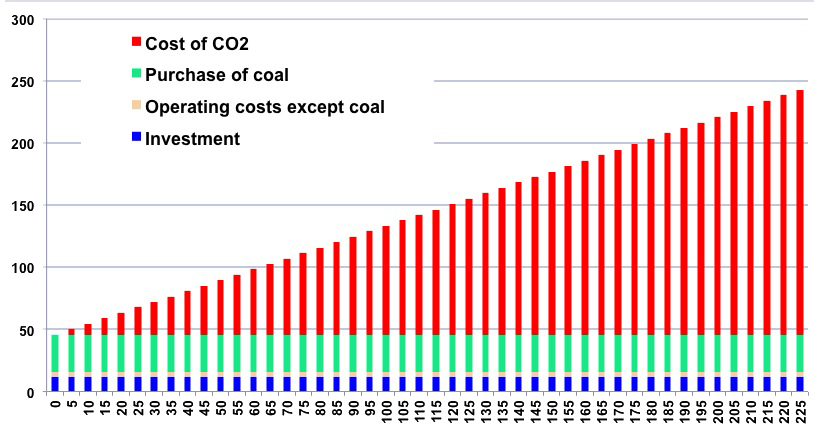
Production cost per MWh for a coal power plant, depending on the price of CO2 (0 to 225 euros per tonne).
The other hypotheses are a load factor of 80%, 1500 euros per installed kW, a lifetime of 40 years, a 4% discount rate, operating costs except fuel that amount to 2% of the initial investment, a 40% yield, and 100 dollars per tonne of coal.
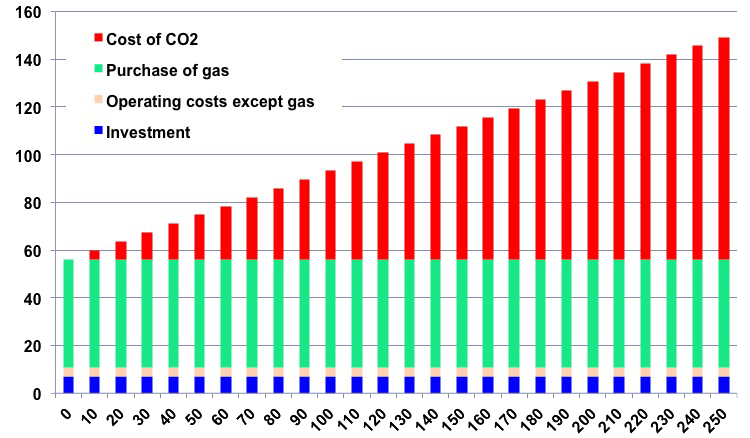
Production cost per MWh for a gas power plant, depending on the price of CO2 (0 to 250 euros per tonne).
The other hypotheses are a load factor of 80%, 800 euros per installed kW, a lifetime of 30 years, a 4% discount rate, operating costs except fuel that amount to 3% of the initial investment, a 55% yield, and 25 euros per thermal MWh of gas.
as the case may be, on other costs (tax on SO2 emissions, on fine particles, etc).
Let’s try to compare
Of course, the interest of such calculations is to allow comparisons. The first go will be made with “classical” hypotheses, which means:
- a 8% discount rate (= perpetual growth is not questionned),
- no CO2 cost (= we don’t care about future climate change)
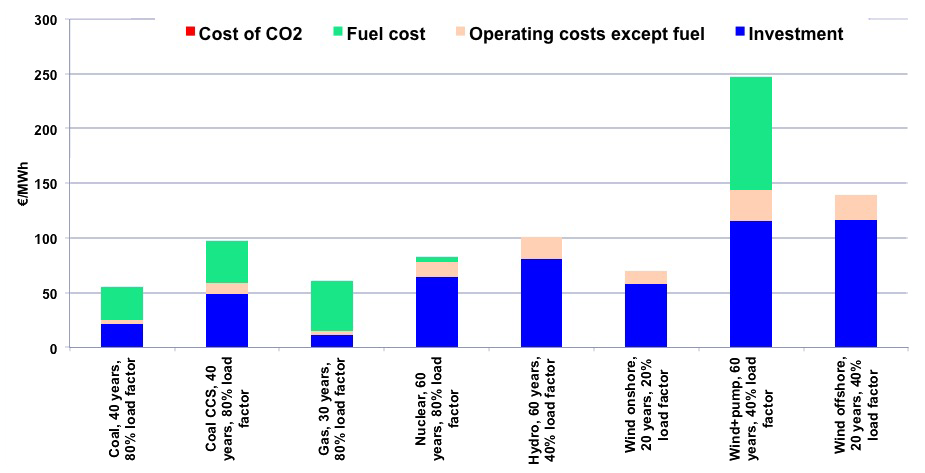
Production cost per electrical MWh depending on the type of plant, with the hypotheses above (the other hypotheses are similar to those used above).
“Coal CCS” means coal with CO2 capture and storage. In such a case the initial investment climbs to 3500 euros per installed kW and the yield falls to 30%.
We see that with conventional hypotheses, the cheapest ways to get electricity in Europe is with coal and gas. In the USA, where the price of gas is three times lower to what it is in Europe (in 2012), gas comes first by far.
In emerging countries, where the construction cost of dams is three times lower, hydro can then beat gas, with a production cost nearing 30 euros per MWh… provided there are mountains, of course!
New nuclear is rather expensive (60 euros/MWh), as… wind, but the first one delivers on demand, when the second one is intermittent and fatal, and can mostly substitute another existing mode when the wind blows. Wind power is therefore a way to save fuel in another plant when there is wind. It means that the full cost of wind should be compared with the sole fuel cost of a gas or coal power plant (that is used in the absence of wind).
We can see that it is not the case here (the full cost of wind is greater than the fuel cost for gas and coal, not to mention hydro – nu fuel cost – or nuclear), which explains why it has to be subsidized. Another way to manage the problem would be to build pumping stations (to act as a storage device), and then the cost of electricity on-demand includes the cost of storage, which is the case for the bar titled “wind+pump”. We have assumed that such a pumping station would cost 5000 euros per installed kW (with no pre-existing dam), operate 40% of the time, and causes a 25% loss for the storage process).
A MWh from wind stored and delivered on demand then costs 250 euros, which is 3 to 5 times more expensive than convenrtional modes (it is a way to say that with intermittent modes the dominant part of the global cost is the management of intermittence).
At last, one will notice that CCS is not competitive with these conditions.
Now let’s imagine that we face a constrained world:
- discount rates go down to 2% (= nobody believes in a perpetual growth)
- it costs 100 euros per tonne to emit CO2 (= we get serious about climate change)
- coal costs 200 $/tonne (which means that it is no longer easily available in the zone where the power plant is) and gas 40 euros/MWh.
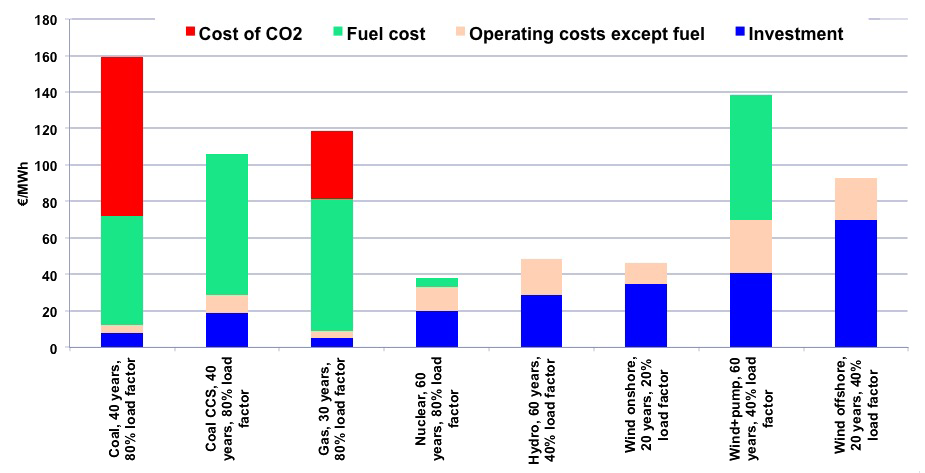
Production cost per electrical MWh depending on the type of plant, with the hypotheses above (the other hypotheses remain identical).
The order of merit changes a bit! Nuclear is the big winner, and hydroelectricity can be even cheaper if the construction costs goes below 2500 euros per installed kW, or if the load factor doubles (which is the case for the run of river).
The full cost of wind becomes inferior to the fuel cost – coé included – for coal or gas. Wind can then be competitive without subsidies to save fuel in a country that already has coal and gas power plants, but then those plants have to be kept, and their load factor decreases, which increases the production cost of the share of fossil that remains.
The cost of a MWh that has to be stored in a pumping station remains much higher than that of nuclear, and even hugher than the cost of electricity from gas.
Let’s talk accidents
Power plants, like all industrial plants, are sometimes in trouble. The biggest trouble is a major accident. Nuclear reactors are not the only plants that can have one: dams can disrupt, with thousands of casualties sometimes (Morvi Dam in India, Vajont in Italy, Frejus in France…). Though they are not “concentrated” in a small number of spectacular accidents, the inconvenients of coal per MWh produced are even far greater.
But below we will concentrate on nuclear, to try to quantify the “possible cost of a major accident” when levellized to one MWh. Here is an example of what could be followed:
- 440 nuclear reactors have been build in the world so far, with a cumulated production of roughly 72 000 TWh (one TWh = one billion kWh),
- There has been one significant accident every 20 years, that required the displacement of 100 000 people (130 000 for Chernobyl, 80 000 for Fukushima).
- We will assume that such an accident costs 200 billion euros of “damage” (the plant itself amount to several billion euros only). Actually this amount depends first of all on the measures that are taken after the accident, that themselves reflect the degree of “precaution” – or the degree of panic ! – which takes place among the population and the authorities. For example, some medical studies suggest that avoiding permanent evacuations after the Tchernobyl accident would have led to a far smaller toll, both sanitary and economic, because the stress of moving people permanently (that led to an increased morbidity) would have been avoided, as well as a loss of production not proportionate to the possible inconvenients of maintaining it. But for the sake of the calculation let’s take a value of 200 billion euros,
- we therefore have 400 billion euros of damages (twice 200 billion) facing 72 000 billion kWh, or 72 billion MWh, which leads to roughly 5 euros per MWh. It is not fully negligible, but, when discussing the order of merit from an economic point of view, it does not profoundly changes the results mentionned above. For example, it is 10 times less than what would be paid for each MWh produced with coal if CO2 had to be paid at a relatively modest level (50 euros per tonne).
It all depends…
What can be concluded from this first overview? That the order of merit of the different ways to produce electricity depends…on the hypotheses chosen. Depending on whether you believe in perpetual growth or not (for discount rates), on whether CO2 should (or will) be penalized or not, on whether coal and gas will long be available at low costs or not, on whether the plant will be used for baseload (80% of the time) or for peak demand (20% of the time), on whether it can last 20 or 80 years, on whether intermittent modes should assume the cost of induced intermittence in the grid or not, etc, results vary greatly, and therefore the possible ranking among the different modes.
It explains why two analysis can lead to very different results: it just takes very different assumptions! Therefore quoting a figure “found in the litterature”, without knowing how it was obtained, to conclude that one mode is definitely superior to another one is not convincing, even though it is a preferred exercise for many people. As it is necessary to go in detail to understand the quantitative conclusions, a direct consequence is that “public” (or “democratic”) debates on the good way to produce eletricity are never easy to conduct.
Let’s head for the consumer!
It’s probably not very frequent that someone plugs a vacuum-cleaner or a washing machine directly into the output of a power plant. Between the plant and the end consumer, we will find a couple cables and power transformers, and all this stuff is called a grid.
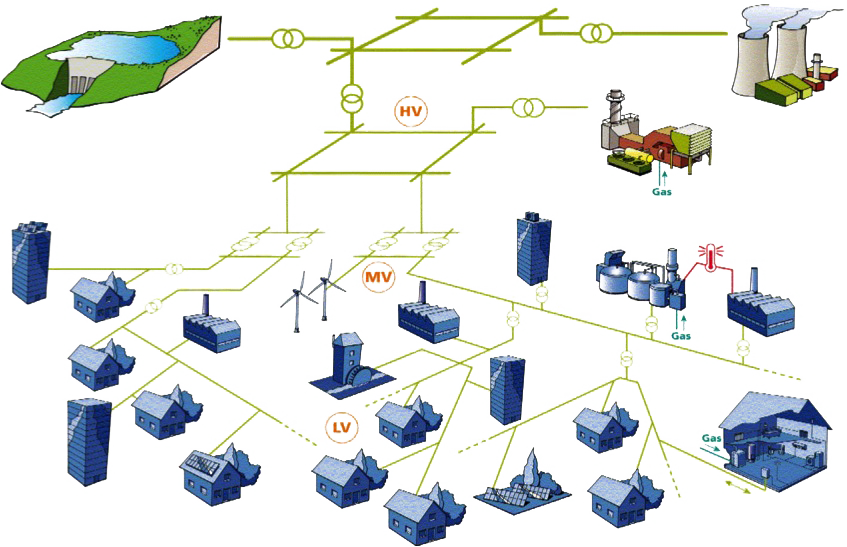
Overview of an electric grid.
Most electricity comes from centralized and controllable plants (coal, gas, nuclear, oil, dams), that inject power at 400 000 or 90 000 volts, which is transported by the Very High Voltage (400 kV) and High Voltage (90 kV) part of the grid (HV on the schematic drawing) to the consuming places (cities, major plants, etc),
The power will then be converted to 20 000 volts (MV pour Medium Voltage). Some large industries (like metallurgy or chemistry) will be served at high or medium voltage, and “small” customers (offices, stores, individuals, etc) use low voltage (LV on the drawing). In France – as in most of Europe – low voltage is 220 V, but a common value in the world is also 110 V.
Some production units (wind turbines, industrial cogeneration) produce medium voltage power, and others (photovoltaic, sometimes biogas) produce low voltage power. In both cases this “local” production has to be injected in the “local” grid (even though it might enable remote consumers to use this electricity, and that raises the voltage of the part of the grid where the injection takes place. The consequence is that there is a physical limit to what a given “local” grid can take from these devices.
The very high and high voltage part of the grid is called the transport grid, and most of the times the lines are aerial. At 20 000 volts and below we have the distribution grid, and the lines are either aerial or underground.
The whole systems relies on several actors:
- the producer owns a production unit (for example a coal power plant) and injects power at high or very high voltage most of the time, but sometimes medium or low voltage (wind turbines, or even solar panel),
- the consumer draws power, most of the time at low voltage (sometimes medium or high), at the other end of the grid,
- the transport system, which is often a national or regional infrastructure, operates lines to carry electricity at high or very high voltage. It has to match constantly the power injected at one end – by power plants, or by other transportation networks, for example at the border of two countries – and the power asked for by the various power stations that serve the local distribution networks (the transportation system therefore doesn’t deal with end consumers, except for the large industries that directly use high voltage). To do so the transport system will organize some kind of bids based on the expectations it has for the demand in the very near future (it’s complicated!),
- end consumers will be served by distribution networks, operating at low voltage. There is hence one distribution network downstream each power station going from 20 000 volts to 220 volts.
- and we also have a distributor, who has the commercial link with the end consumer. This company buys electricity to the producer (or owns its own plants), buys the transport to the transport system, buys the distribution to a local grid, adds taxes, and sends a global bill to his client.
In the description above, neither the transportation system nor the distribution networks work for free: they ask for something! The full cost to go from a plant to the end consumer amounts typically to several tens of euros per MWh in France (or several cents per kWh).
Of course, losses in the grid are taken into account to calculate the transportation price. Indeed, as soon as electricity runs, heat is lost through the joule effect. The losses are proportional to intensity, not to tension (which is why, to carry the same power, the higher the voltage, the lower the intensity, and therefore the lower the losses).
Let’s give figures: on the very hight voltage network, losses represent roughly 2% of the electricity transported for one thousand km (the theory says it is proportional to the length of the line), then an additional 5% is lost in the power stations decreasing the tension and in the distribution network. The distance between an end consumer and a very high voltage power plant is therefore not the first cause of losses. Of course, if one day the grid should store part of the electricity, then storage losses will come on top (25% with a pumping station, up to 70% with fuel cells for example).
These losses explain why production figures are always superior to consumption figures (by 8% in France, and it will be more if there is massive storage), so be careful to which ones you are looking at!
Let’s talk sustainable development
In a number of countries, governments openly support specific modes to produce electricity (not only renewable, it can for example concern cogeneration with gas). The common way to do so is not to directly subsidize a given producer (which, by the way, would not be possible in Europe right now), but to oblige the existing distributors to buy all the electricity produced by the means supported, at fixed prices (called feed-in tariffs).
The money spent by the distributor (sometimes given to a competitor, if the distributor is also a producer) will then be charged to the end-user, through a special contribution, generally proportional to the amount of electricity sold (it is therefore a supplement per kWh, and not per consumer and per year). Such a mechanism can be used to support:
- industrial cogeneration: when an industry has a boiler that produces both heat and electricity (cogeneration), it can inject part or all of the electricity produced into the grid, with a price per kWh generally higher than the production cost of centralized plants,
- electricity coming from a waste management site (methane from a landfill, then burnt to produce electricity, or heat from an incinerator, also converted partly into electricity),
- wind or solar,
- small hydro, geothermal, biogas…
In some countries, the end consumer also has to subsidize the price for some particular end-consumers. In France, for example, it concerns islands, where the production cost of electricity – a large fraction comes from fuel oil – is superior to the market price in the mainland. With a barrel at 100 dollars, the production cost will be no lower than 190 dollars, or 160 euros, when the price for domestic consumers in the mainland is 130 euros per MWh. In the name of equity, the kWh will be sold at the same price in the islands and in the mainland, and the consumers in the mainland will pay for the difference between the selling price and the production cost in the islands.
In Europe, most of the money involved in mandatory purchase of specific electricity concerns wind (with a feed-in tariff a little below 100 euros per MWh for onshore wind, and a little below 200 euros per MWh for offshore wind), photovoltaic (feed-in tarif ranging from 150 to 400 euros per MWh), biogas and cogeneration. This price is generally guaranteed to the producer for a minimum amount of time (for example 10 years for wind, 20 years for solar).
An amusing thing is that feed-in tariffs correspond to a 8% discount rate for the producer (otherwise they would be much lower), which means that our states accept to subsidize profits at the “financiel norm” for something that benefits from public money and is without any risk!
In fact, what is going to be charged to all electricity consumers is not all of the feed-in tariff, but the difference between this tariff and the market price paid to regular producers. Indeed, a distrbutor must buy electricity from a producer – or support production costs – anyway, and therefore when the has to buy over the market price it is only the surplus taht represents an extra cost.
The end-consumers alltogether will therefore pay an extra cost, which is, for all the electricity that comes from subsidized producing devices, the difference between the feed-in tariff and the average market price. To give an idea of how much money we are talking about, I give below the results of a simulation performed from 1996 to 2040 with the following assumptions:
- the overall electricity generation is stable, a little over 550 TWh (550 billion kWh) per year
- the installed capacity for wind increases progressively to 25 GW, with wind turbines that have a lifetime of 20 years,
- the installed capacity for solar increases progressively to 20 GW, with panels that have a lifetime of 25 years,
- the feed-in tariff for wind is 82 euros per MWh in 2012, and decreases by 2% each year (average value for the whole installed capacity). For solar, it is 400 euros per MWh on averagein 2012 (including constracts concluded before, of course) and it decreases by 5% each year on average for the whole installed capacity,
- the market price remains at 50 euros per MWh over the period (it’s a simple hypothesis to give an idea), and what is counted as an extra cost is the difference between the feed-in tariff and the market price,
- When the feed-in tariff – that decreases each year – becomes equal to the market price, the extra cost becomes nil,
- when wind turbines or solar panels are renewed, it is the conditions that prevail at that moment which apply to the new infrastructure,
- the load factor of wind turbines is 17% for wind and 10% for solar.
Les two curves below first give the total installed capacity and the annual increase over the period.
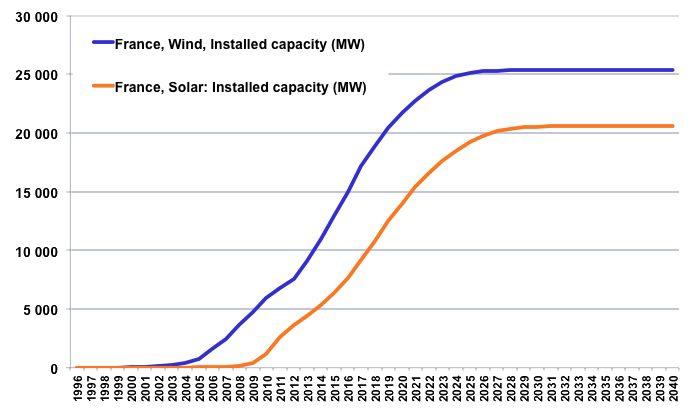
Simulation of the total installed capacity in wind and solar over the period.
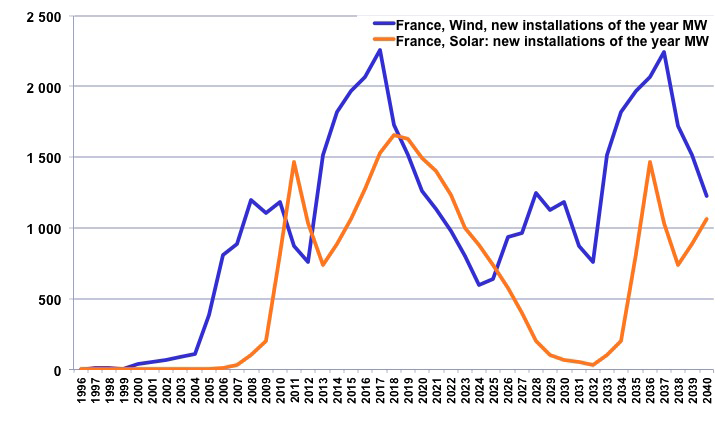
Simulation of the annual installed capacity in wind and solar over the period.
The graph below then gives the annual amounts that are necessary to finance the feed-in tariffs (it is – again – the difference between the market price and the tariff). It is not all that is paid to the producers (they also get the market price), and it does not include all that has to be paid “elsewhere” (grid reinforcement, among other things).
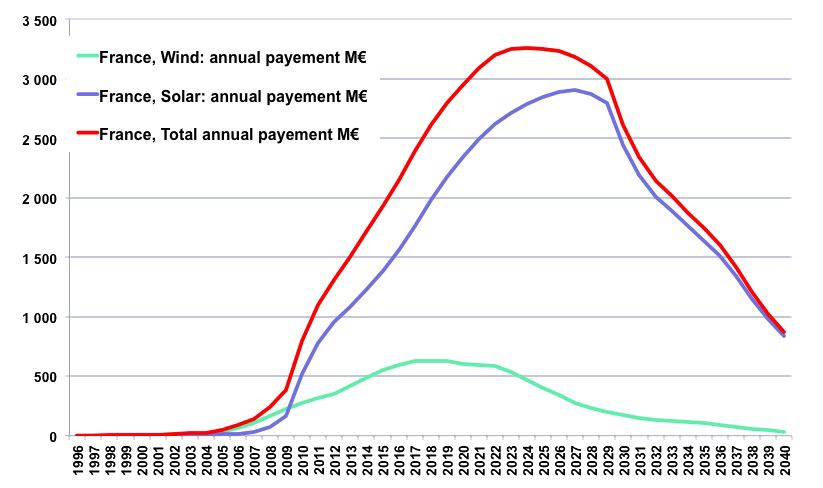
Annual costs (over the market price) paid to producers with the above hypotheses
(the annual electricity consumption corresponds to that of France).
The cumulated cost would be of 70 billion euros, but the producers will receive 130 billion euros (the market value of the electricity produced is 60 billion euros).
But when intermittent modes increase greatly, there are other costs, and it remains a question whether the correct method is to take them into account for the “full cost” of a MWh produced with these modes, or not. The induced costs in such a case are :
- connection costs (much greater with a flock of production units of several MW scattered everywhere than with few centralized units), and the reinforcement of the grid (when switching from baseload to intermittent modes, carrying the same amount of electricity means a higher peak power sustained over less time)
- as the case may be, the construction cost of backup plants (gas, coal), and then the cost of importing these fuels if they are available, or the cost of suppressed GDP if they are not available,
- the cost of CO2 if the backup means are fossil, and the cost of storage if not…
Without taking into account all these potential extra costs, the graph below gives the impact on the price per kWh of the program described above.
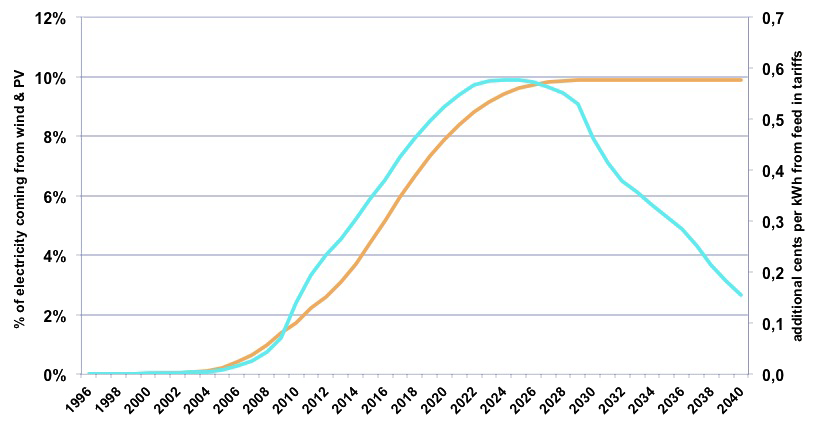
Percentage of the total production coming from wind and solar with the above hypotheses (orange curve, left scale) and additional cents par kWh resulting from what is paid to the wind and solar producers (blue curve, right scale).
Concluding that the above sums are ridiculous or excessive is, again, a matter of point of view:
- some will say that a couple cents per kWh (including induced costs) is not much when a kWh is already sold at 12 cents in France, and twice that amount to the individual in Germany, and that’s a perfectly sound conclusion if this price increase goes with a benefit,
- Some others will say that, precisely, there is not benefit: the above simulation means spending 70 billions euros to substitute 10% of the French electricity with no gain on CO2 (France basically used nuclear and hydro), no gain on energy imports (uranium imports in France amount to less than 1 billion euros per year, and exports of electricity represent several billion euros), no gain on the trade deficit (solar pannels and wind turbines are mostly imported), and probably no gain on the global amount of jobs).
Of course, we can try other hypotheses. The graph below has been done with the following ones:
- the feed-in tariff for wind increases by 5% per year to include (or kind of) connection and grid costs, and for solar it remains at the current level for the same reasons,
- wind and solar output raises to 130% of the present electricity generation to account for storage losses (but storage costs are still not included).
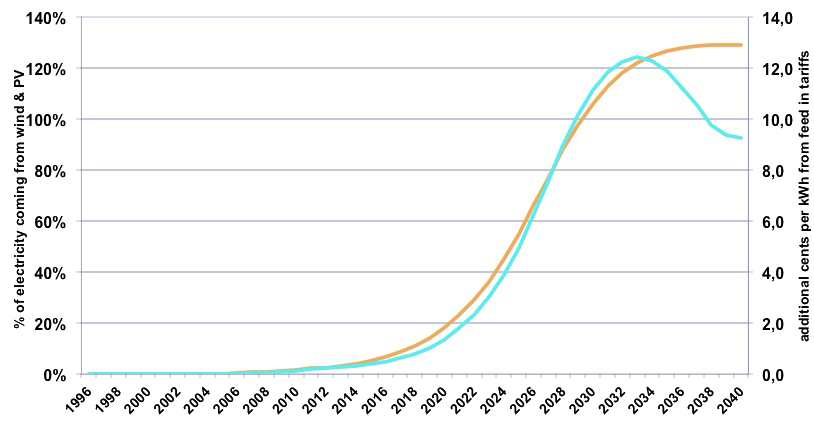
Percentage of the present production coming from wind and solar with the above hypotheses (orange curve, left scale) and additional cents par kWh resulting from what is paid to the wind and solar producers and the grid costs (blue curve, right scale). This still does not include storage costs as the case may be.
Are we done yet?
At this point, we know that the end-consumer must pay:
- electricity production, which includes:
- amortization of the capital cost of the plant,
- the fuel cost if any,
- the cost of CO2 if any
- other operating costs (employees, waste treatment, maintenance, etc),
- provisions for future costs, like dismantling (which is the case for any large plant),
- as the case may be, insurance costs or provisions against accidents.
- transport and distribution costs,
- subsidies to specific generation.
Is that all? Not yet: there are also taxes, like VAT and local taxes. And, in a market economy, something else will be found: the profits of the producer, the distributor, and the transport system operator. These profits are at least a fraction of the costs, but they can represent much more, because the direct effect of putting electricity into the market – what Europe has decided – has created windfall profits. Before this moment, prices where decided by public authorities and evolved in a rather predictable way. In this game there was little room for profits coming from unexpected situations, and the price for the end consumer changed roughly as the production and transportation costs.
But now a significant fraction of the sales (not all) are done through markets, which organize some kind of permanent bids. When a kWh is sold this way, its price is not only a reflect of the production cost: it also depends on the desire that the consumer has to get this kWh. The stronger the desire, the higher the cost. Besides, as the producer that supplies the electricity generally has several types of plants, it will use first those that have the lowest production cost, then the second lowest cost, and so on.
It means that electricity is a product where the marginal production cost is rising when the global demand rises, and not the opposite, which is generally what we are accustomed to (if we produce more shoes, we expect the production cost per shoe to decrease). But as the electrons never say where they come from, when the marginal production cost increases, all the other producers will increase their selling price accordingly, since the marginal price is the market price! Free competition in the electric sector, when the demand increases, therefore results … in higher prices, and higher incomes for producers. The opposite effect happens with a decreasing demand: the highest marginal costs are stopped first (often gas, see above) and the market price can often fall bellow the average production cost. A high share of intermittent modes can increase this effect, as in Germany.
Let’s talk of the future
This little trip in “terra electrica” shows that many components contribute to something we often think very simple. This will also explain why trying to guess a future price is a wild guess! Indeed, the various components can follow unpredictable paths:
- for gas, coal and oil fired power plants, it requires a guess on the future price of fossil fuels, as well as a guess on the future penalty for emitting CO2,
- for “non fossil” modes (nuclear, renewables) it means a guess on the future discount rates, and future lifetimes,
- and on top of that a guess on what will be future taxes, subsidies, the cost of transportation, and he existence of a “perfect market” or not!
There is therefore no chance that looking ahead makes things easier… and we have to cope with that!