Models do not allow, for the time being, to give a formal answer to this question. This does not mean, of course, that the number of extreme phenomena or their violence will not increase ; various evidence even suggest that it might even be the opposite. But we are only considering evidence here, not formal proofs, because models reach their limits on this point.
Why is it that models are not able to give a definite answer ?
- Climate simulation is only several decades old. Back then, extreme phenomena did not passionate the public, neither the scientists, that mainly tried to understand how the main components of the climate system functionned. Hence models were not conceived to study specifically extreme phenomena, and anyway it seems difficult to make any statement whatsoever on these phenomena as long as the main determinants of climate have not been made clear !
- In order to be able to predict with an acceptable accuracy the evolution of such extreme phenomena, that have a size of a couple hundred kilometers or less (a hurricane has a diameter of 500 to 1,000 km, a tornado of less than 1 km, a thunderstorm is several km wide…), one must work with models that have a mesh size (see models) of a couple km at most, like the ones used for weather forecasts. Well, the global climate models used today have meshes several hundred kilometers wide, which is far from enough to analyze with a high confidence degree the frequency and magnitude of these phenomena.
- But some evidence can still be derived from the analysis of the results of simulations.
Variability
Variability is what designates the frequency and the magnitude with which a given value deviates from the mean.
As its name states it , an extreme phenomena is a process with “extreme” values compared to the “normal” ones, that is the ones close to the mean value.
An extreme phenomena hence corresponds to a case when at least one parameter of the climate (pluviometry, wind, temperature…) is very far away from its mean value. In the winter, a temperature of 25 °C (in France !) will be considered “extreme”, because the mean value is much lower. Meteo France (the french national organism in charge of weather forecasts) often qualifies temperatures as “far away from the seasonal means” or “normal given the season”: it is another way to say that they are “far from the average” or “close to the average”, or more simply “extreme” or “normal”.
By examining if, as years pass by in the simulated climate, instant values yielded by the computer (that concern temperature, pressure, etc, see the page on models) become more and more erratic over the length of the simulation (one century, two centuries…), and most of all how they compare to the mean calculated at the end of the simulation, one can try a beginning of conclusion on the evolution of the variability of the future climate.
If this variability of the simulated climate increases, it means that there is a risk that the real climate includes more and more unusual values in the future, “far away from the mean”, and therefore a probable increase of the number of extreme phenomena, and/or of their magnitude.
For a restricted number of simulations (not for all), the variability of the future climate has been studied. The concerned models all yield an increase of this variability, particularly for the water cycle. This means that we can expect a probable increase of:
- floods,
- droughts (and maybe…intense frosts for middle latitudes).
Some simulations also predict an increase in storms (what is materialized by an increase of high values for the wind speed). It is a first result, that needs to be investigated further, but that still indicates that there is a risk to see more extreme phenomena, even though it is not possible to conclude on the precise locations that might be concerned, or the magnitude of the increase(s).
El Niño and La Niña
El Niño and La Niña show an interesting example of the difficulty there is to locate the exact place where “something” will happen as a result of a “simple” temperature increase, and how a chain reaction can lead to catastrophas starting from that increase.
Indeed, the observed consequences of El Nino result from a variation of a couple degrees only (2 or 3 °C) of the surface temperature of the Eastern Pacific Ocean (actually it is an inversion of temperatures: the normally warmer water of the Western Pacific shift to the Eastern Pacific as a result of a weakening of the Trade Winds, that normally push them Weswards).
Well, the consequences :
- happen for some of them thousands kilometers away from the starting process (that increase in temperature in the Eastern Pacific)
- are “harmless” for given zones but might be catastrophic elsewhere: intense droughts in Indonesia (the last episode led to gigantic fires, something expectable when there is a drought because we must never forget that men are everywhere), diluvian monsoon over the Andes – with landslides afterwards, and temporary vaniching of large fish populations off Peru, among other things.
What about tropical hurricanes ?
If we look more precisely at the problem of tropical cyclones, one of the necessary conditions that must be fulfilled for such a process to begin is that the temperature of surface water is above 27°C (because the ambiant temperature conditions the maximum evaporation flux, and this flux must be over a certain threshold for a cyclone to take place). If the zone where this minimal temperature is reached becomes larger, one is tempted to consider, a priori, that is will favor more frequent hurricanes. This being said, climate models do not give any useful information that allows to confirm or infirm this hypothesis (see table below).
By other ways, the “pump” that sets the hurricane in motion is a very strong convection between the surface – very warm – and the high atmosphere – cold (at the beginning of the stratosphere, the air temperature is around -50 °C). The higher the temperature difference between the surface and the stratosphere is, and the most powerful the convection will be. Well it happens that climate change should result in an increase of the average sea surface temperature, but in a correlative cooling of the higher atmosphere.
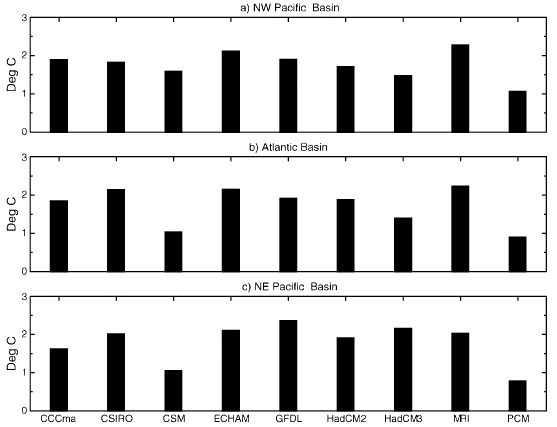
Increase of the average sea surface temperature of various oceanic basins in 2080 (compared to 2000) assuming a 1% yearly increase of the atmospheric CO2. NW Pacific is for “North West Pacific”, Atlantic speaks for itself, and NE Pacific is for “North East Pacific”. It is quite clear that the sea surface temperature is expected to increase if the CO2 concentration increases. The various acronyms (CCCma, CSIRO, etc) designate the various models used for the simulation.
Source : Knutson et al., Journal of Climate, 2004
One can therefore fear more violent hurricanes in a modified climate, and this eventuality is considered as likely on the grounds of the most recent results.
Hence, if no formal answer can be given to the question of the evolution of bad surprises, available evidence suggests that things should rather evolve in the wrong direction, particularly for the intensity of extreme phenomena, as long as the climate warms up. It won’t necessarily be the case once the average temperature is stabilized, but this is not for tomorrow !
What does the scientific community says exactly ?
The state of the art knowledge on the evolution of extreme phenomena, in the future, along with the possible link existing between the warming already observed and some recent extreme phenomena (as the ones evoked below) can be summarized in this table published in the 2007 assessment report of the IPCC:
| Change studied | Likelihood that trend occurred in late 20th century (typically post 1960) | Likelihood of a human contribution to observed trend | Likelihood of future trends based on projections for 21st century using SRES scenarios |
|---|---|---|---|
| Warmer and fewer cold days and nights over most land areas | Very likely | Likely | Virtually certain |
| Warmer and more frequent hot days and nights over most land areas | Very likely | Likely (nights) | Virtually certain |
| Frequency of Warm spells / heat waves increases over most land areas | Likely | More likely than not | Very likely |
| Frequency of heavy precipitation events (or proportion of total rainfall from heavy falls) increases over most areas | Likely | More likely than not | Very likely |
| Area affected by droughts increases | Likely in many regions since 1970 | More likely than not | Likely |
| Intense tropical cyclone activity increases | Likely in many regions since 1970 | More likely than not | Likely |
| Increased incidence of extreme high sea level (excludes tsunamis) | Likely | More likely than not | Likely |
Are the hurricanes that went through western Europe in december 1999 (Lothar and Martin) the consequence of climate change ?
According to what preceeds, it is premature to say that these hurricanes – and not simple storms – are a consequence of global warming.
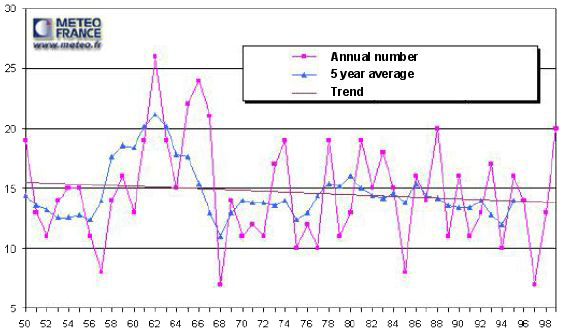
Number of observed storms or hurricanes in France between 1950 and 1999.
It is difficult to establish a given trend regarding the number of events. This graph says nothing on the intensity of the events (that is whether they are much over or just a little over the minimum wind speed that qualifies a storm).
Source : Meteo France, 2002
How could we be sure ? We would reach a certitude that these hurricane result from climate change if we were able to make the following experiment: 50 times, we put the earth in 1900 and inject extra greenhouse gases in the atmosphere then observe what’s going on, and 50 times we put the earth back in 1900, do not inject extra greenhouse gases in the atmosphere, and observe what’s going on.
If the 50 times we inject extra greenhouse gases in the atmosphere we get a hurricane in Western Europe in december 1999, then we can judge the case: without our action (and without any doubt !), these hurricanes would not have happened, and therefore we can say that they are a consequence of human induced climate change.
But, of course, as it is not possible to turn the clock backwads ! We will therefore never be able to do “the” experiment that would allow to get a definite answer to the question asked at the beginning of this chapter. All we can do, then, is take a climate model, refine it until it reproduces the most correctly possible the observed climate, then simulate if we get more storms whan we an increase the concentration of greenhouse gases in the atmosphere. And so far, this kind of simulation has not been done frequently enough, with a normalized intermodel comparison, so that someone can give an answer for this precise event, and it will probably never be possible to give one.
All we can say is that an increase of the intensity of storms or hurricances is coherent with indications given by climate models, particularly for the asssociated floodings. One can also be troubled by the comparison between the conditions that allowed these hurricanes to happen and the predictions of a number of simulations.
The “engine” of a storm or hurricane is always a temperature or moisture difference difference between two air masses (the term gradient is sometimes used). Well, several simulations conclude that climate change should not heat much – or even cool – the air located over northern Europe (actually near Greenland, as a consequence of the slowing down of marine currents) but heat significatively the air located over southern Europe.
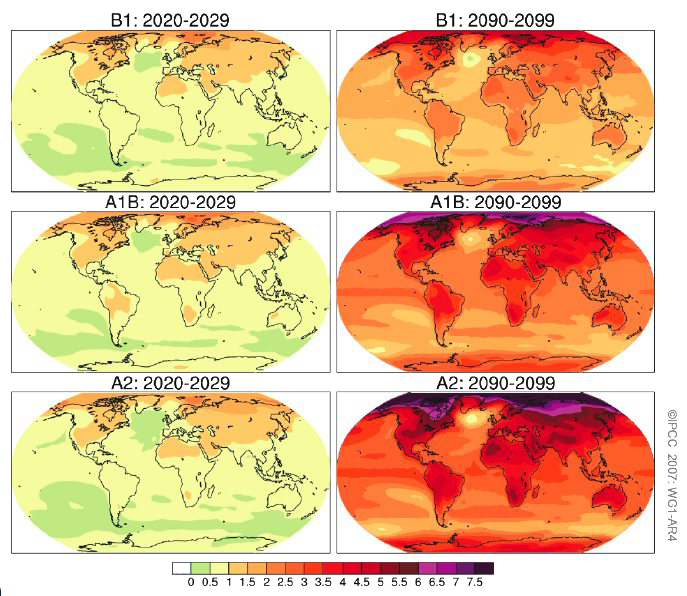
The above maps represent, for three different scenarios (B1, A1B et A2 ; that is in rough terms emissions that remain stable, that double, or that quadruple), the average temperature increase compared to the 1980-1999 mean.
- on the left the increase is for the 2020-2029 decade,
- on the right the increase is for the 2090-2099 decade.
6 to 8 models have been used and the results are averaged..
Source: IPCC, Summary for Policymakers of the 4th assessment report (working group 1), 2007
- One might recall that the hurricanes of december 1999 originated in the meeting, over France, of an air mass unusually warm, that came from the southwest, with an air mass unusually cold, that came from the Northwest (both air mases travelled over the Atlantic before),
- As a consequence, an evolution like the one drawn above would probably “help the odds” for the future happening of hurricanes like the ones Western Europe experienced in 1999.
More generally speaking, models often predict gradient increases here or there, but not necessarily at the same places (which is a normal consequence of their limits). If a future increase of the number of violent storms in Western Europe cannot be deducted from the available data, this event “gives an idea” of what could happen in the future.
Two last points are important :
- if this kind of phenomenum is already a consequence of climate change, the worst is probably to come, as the change is bound to increase whatever we do for at least a century,
- Even though it would be established that the number of hurricanes in Western Europe will not increase, it doesn’t mean that climate change is a harmless process !.
Are the floodings that happened in Germany in summer 2002 linked to climate change ?
Same question, same answer: in order to have a deffinite answer, we would need to see how would evolve a planet that would not have received any extra greenhouse gases since 1750: it is a difficult experience to perform ! In addition one should not forget that, in order to have consequences from a flooding, we need a swell … and buildings or infrastructures that might be damaged. Well, urbanization has always happened along rivers (in Europe there is not a single town or city that is not crossed by a river !), and land that cannot be flooded is generally built first. The constant desire for new buildings then led to use land that is liable to flooding. Hence, with the same elevation of the water level, there are more and more things to flood: when damages increase, attribution of causes between what is purely climatic and what is purely the result of land use change is not necessarily easy.
Then, there is no simple link between the amount of rain that falls over the river basin (for which an attempt to establish a link with climate change might be conceived) and the river flow: the relationship depends on the rate of precipitations, the kind of land use of the river basin (forests, crops, rocks…), the season (if we have snow instead of water things change a little…), the harnessing of the river shores (whether there are discharge basins or not, or, on the opposite, embankments that constraint the flow) ; in short there are so many conceivable reasons why this could have happened anyway that stating that the summer 2002 floodings in Germany would not have happened without our greenhouse gases emissions would be a very bold statement (that no scientist dares to make).
And at last Mother Nature did not need our greenhouse gases to flood Paris in 1910, and if we had the same amount of precipitation over the Seine basin today Paris would be flooded almost the same way (the dams upstream would allow a diminution of the swell of 20 to 30 cm). Would everyone see the mark of climate change anyway ?
What is the non debatable proof of a climate change is therefore not the mere existence of such phenomena, but a change in their frequency. We would reach a certitude if, in a century, we get one such event every ten years instaed of every century. But when (or if) we get there it is too late to reverse the situation. And, without lacking a necessary prudence, it is possible to state, since climate change should lead to an intensification of the water cycle over Northern Europe, that these floodings give a reasonnable idea (more than for hurricanes) of what might well happen in the future (see table above). It is already considered as “likely” that heavy precipitations events have increased, and more, “more likely than not” than our industrial civilization is involved.
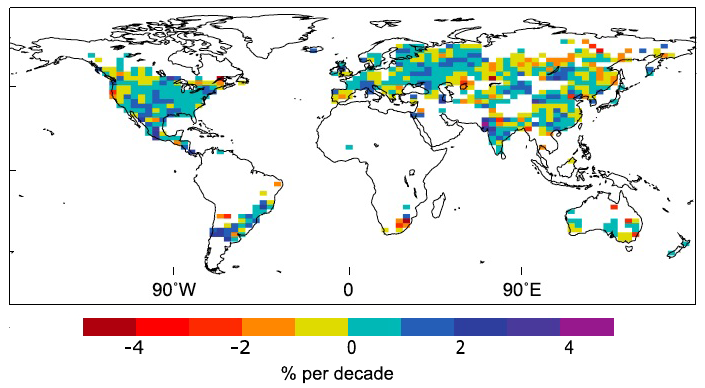
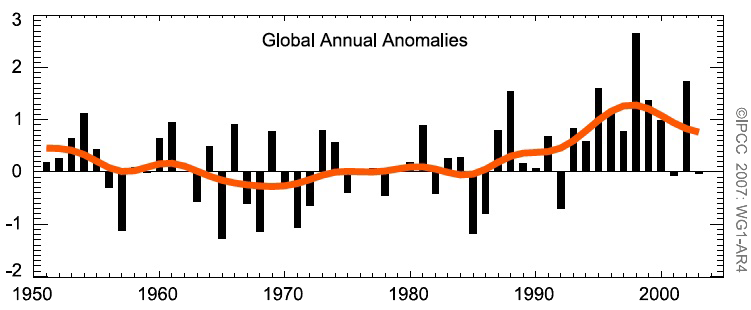
Average change per decade, over the 1951 – 2003 period, of the contribution of very wet days to the precipitation total. White zones correspond to insufficient data to establish a trend. An increase of this contribution means that total rainfall gets a little more concentrated in some heavy rainfall events, which is neither good for the ecosystems, nor for human settlements (floodings).
Below, same information, but for the fraction of the global land where sufficient data exists (that is the coloured zones above). The 0 of the vertical exis corresponds to the average contribution of intense precipitation events to the rainfall total for the 1961-1990 period, which is 22,5% (22,5% of total rainfall happens during “intense” events, named as such because they generate more rain than 95% of precipitation events – sorry for all these figures !).
The vertical bars show, for the considered, the deviation from this average value of 22,5%, in % also. For example, in 2000, intense precipitation events contributed to the total rain 1% more than the mean, that is 23,5% of the total rain happened during such intense events (for the zones where date is sufficient, coloured on the map above).
Source: IPCC, 4th Assessment report, 2007
Just as for hurricanes, though, the answer for the future (will we get more ?) is much more easy to give than the anwser for the past, since the relative influence of the additionnal greenhouse gases is not as important today at what it should be later.
The same questions sometimes arises for the floodings events that happened in the South of France in 2002 and 2003. Same answer than for the storms: too soon to decide….
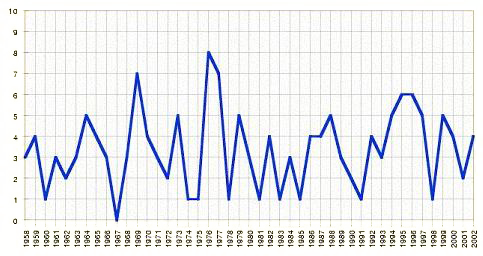
Number of intense rainfalls in the South East of France between 1958 and 2002. An intense rainfall corresponds to more than 100 mm of water in less than 24 hours.
It is also difficult to detect a clear trend on the number of episodes, but, as for storms and huricanes, this graph says nothing on the overall amount of water that fell.
Source : Meteo France
Is the heat wave of the summer 2003 in Europe the consequence etc… ?
Is a full development really necessary ? Once again, it is not the happening of a single hot summer, even if records have been broken everywhere, that allows to give a definite answer regarding the link between past emissions and this precise event.
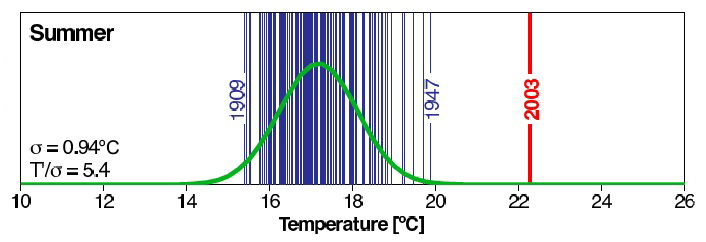
Distribution of summer means in Switzerland for the years 1864 to 2003.
Extremes before 2003 – but since the beginning of instrumental records – were 1909 for the coolest summer (the average temperature was a little over 15° C) and 1947 (hottest summer on record, with an average a little below 20 °C). It is easy to notice that 2003 completely “breaks” the previous record, and is more than 5° C away from the mean, when the standard deviation is less than 1 °C !
It is therefore tempting to see here the result of our influence on the climate system. But only the increase of the frequency of such heat waves will bring a definite answer, when it is too late to do anything to reverse the trend, of course.
Source : IPCC, 4th Assessment report, 2007
Neverthess, it is likely that this episode gives a good idea of what we should experience in the future, and it is even likely that on this precise type of event (heat waves) we should expect much worse in the future (see graph below).
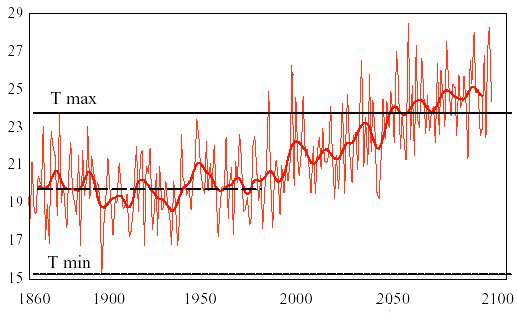
Simulation of the mean july temperature for France between 1860 and 2100, with greenhouse gases emissions following the A2 scenario (see page on scenarios) after 2000.
From 1860 to 2000, the curve is complying with the average temperatures obtained from instrumental data.
One can note that the temperature experienced in France during the summer 2003 could well correspond to the normal situation a little after 2050.
Source: Jean-Louis Dufresne, IPSL, 2003