It is an obvious fact that all vegetal species dont thrive everywhere: a palm tree in Norway or an oak tree in the middle of the Sahara won’t be very pleased there. Stating this truism is actually a way to say that vegetal – and animal – species that constitute ecosystems are adapted to the local climatic conditions, and might often bear small changes but not survive to big ones.
The main point concerning vegetation is that the amount of available water determines much more the possibility to find a given plant than the average temperature, the threshold regarding the latter being often frost. Hence if precipitations change a little, the vegetation type changes quickly, when if temperatures change a little, with constant precipitations, vegetation types won’t necessarily be drastically modified. Said differently, it means that temperature variations are not necessarily dramatic for the vegetation, as long as they remain limited to a couple of degrees, when changes in precipitations can very rapidly be.
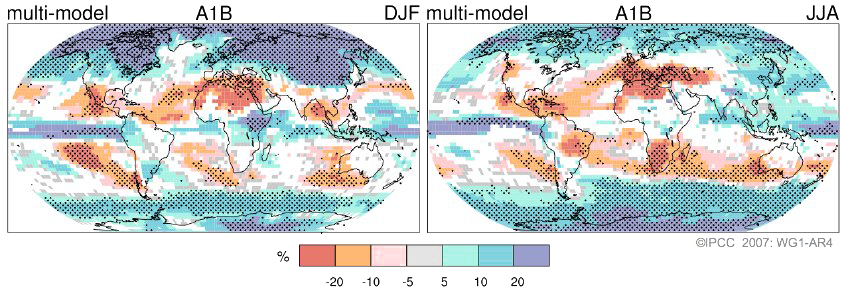
Multimodel ensemble of the regional precipitation change for December – January – February (left) and June-July-August (right) during the 2090-2099 period compared to the average over 1980-1999, with the A1B emission scenario (emissions roughly double over the 21st century).
White boxes mean that there is no sufficient consistency among simulations (it is impossible to establish a trend). Regions are stippled where at least 80% of models agree on the sign of the mean change. It is easy to notice that regional trends wan greatly vary depending on the season, even though a clear trend can be established for the whole year (below).
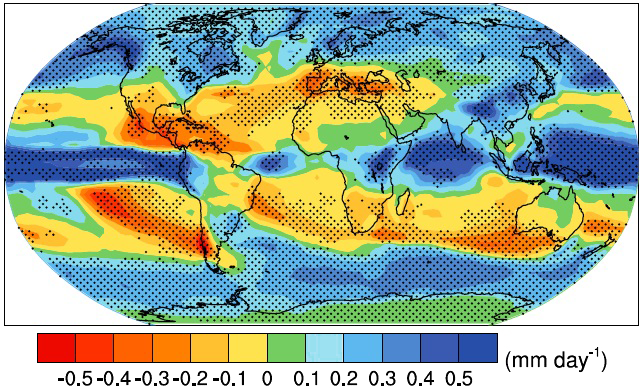
Multimodel ensemble of the regional precipitation change for the 2080-2099 period compared to the average over 1980-1999, with the A1B emission scenario (emissions roughly double over the 21st century).
The difference is scaled in mm of rain per day, knowing that 0,5 mm/day ≈ 180 mm/year, that is one fourth to one fith of the annual total for most mid-latitudes. Regions are stippled where at least 80% of models agree on the sign of the mean change.
Source : IPCC, 4th assessment report (working group 1), 2007
We will then have to do with a “generic” exam of the possible consequences of climate change on vegetation, complicated by the fact that enriching the atmosphere in CO2 is something rather positive for vegetation (but it is of course not possible to dissociate the biological benefit of enriching the air in CO2 from the adverse climatic evolutions that might result from the same CO2 !). So how does a climate change can affect plants, and, consequently, ecosystems ?
- A climate change can move suitable zones too quickly for the vegetation to follow:
- A suitable zone corresponds to a region where it is “pleasant to live” for a plant . If it moves slowly it is not very serious: the population of plnats moves also and survives (see little figure below). If the suitable zone moves too quickly, the population disappears because it doesn’t have the time to reproduce and migrate before the conditions cease to bo adapted.
The two graphs below show how a favourable zone can move. The successive shades of orange show where it stands today, where it will stand when the seeds scattered today have produced sexually mature plants (in M years), and where it will stand when the scattered seeds have themselves produced sexually mature plants (in 2M years).
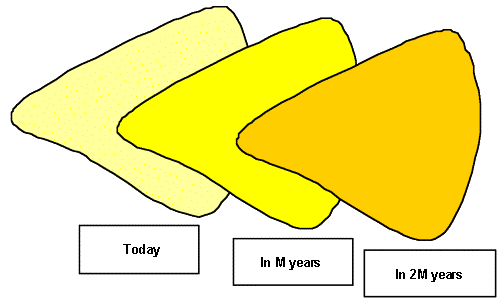
Slow displacement speed
The plants on the right edge of the favourable zone have the time to produce seeds that will germinate a little farther, and produce sexually mature plants before the place where they are stops to be favourable. The population moves and survives.
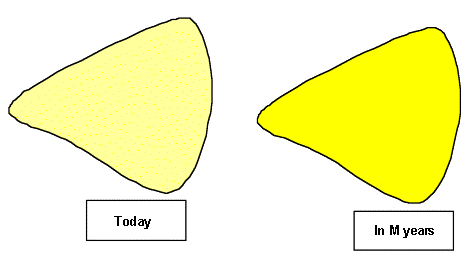
High deplacement speed
before the plants issued from the seeds scattered today become sexually mature, the whole zone where they have germinated has ceased to be favourable: the population gets extinct.
-
- depending on the species, the maximal “migration speeds” vary from 4 to 200 km per century. This speed is lower for plants that are mature late and have low mobility seeds (that therefore can’t go very far from the favourable zone of the moment) ; oak trees (sexual maturity at 50 years, heavy seeds and few animals that transport the acorns) represent a typical species with a slow migration speed.
- Well according to the IPCC a global warming of 3° C will generate, for the temperate zones, a polewards displacement of the favourable zones of 500 km or so. 3° C in a century – median evolution in the bracket of the present predictions going from 1 to 6°C – therefore generates a displacement speed by far superior to the 200 km at most indicated above. In addition, it is probable that continents, that don’t have the thermal inertia of oceans, will undergo superior temperature increases. A large number of natural species, including trees, might therefore vanish in case of a brutal modification of the climate, because where the suitable zone used to be conditions became too hostile. An example of such a change is given below for two species in France (beech and spruce).
NB: a “suitable zone” doesn’t mean that a given species will be necessarily found somewhere, but only that it can be found. For the tree taken in example, if people chop down everything, if a pest decimates a whole population, etc, there will not be any trees left in a place where they neverthelss could be !
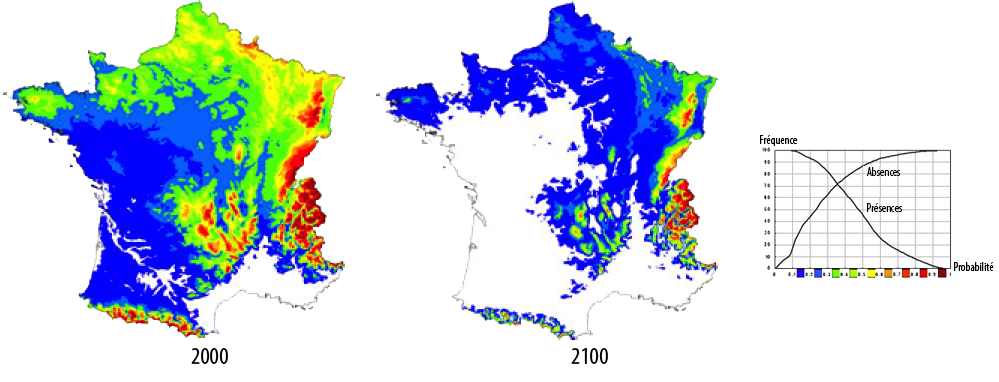
Simulated distribution of beeches in 2100, and potential in 2000, with the B1 scenario (constant emissions over the 21st century, more or less).
Numerous zones of the country would become too hostile for this tree (beeches presently living in these places will thus die). This simulation is of course not a forecast: impossible to take into account the effect of pests, of competition between species, and of course of the action of man (destructive or not).
Source : Modélisation et cartographie de l’aire climatique potentielle des grandes essences forestières françaises, Badeau et al., june 2004
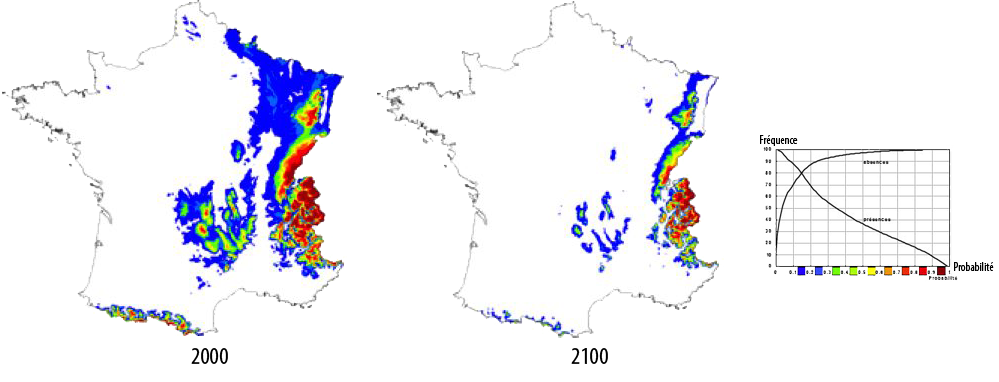
Simulated distribution of spruce in 2100, and potential in 2000, with the B1 scenario (constant emissions over the 21st century, more or less).
The same remarks than for beeches apply.
Source : Modélisation et cartographie de l’aire climatique potentielle des grandes essences forestières françaises, Badeau et al., june 2004.
- If the favourable zone moves, it means that the zone previously favourable has ceased to be. What might have happened ?
- the weather might have become too dry (8.000 years ago part of the Sahara was covered with an abundant vegetation, hence proving that a local weather can become much dryer). A “dryer climate” can actually result from a mixture of less precipitations, precipitations concentrated on a restricted number of heavy rain, and more intense evaporation, both the latter leading to a dryer soil.
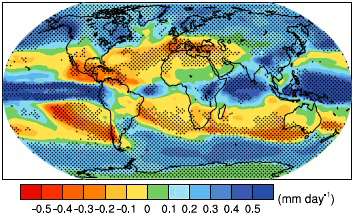
Multimodel ensemble of the regional precipitation change for the 2080-2099 period compared to the average over 1980-1999, with the A1B emission scenario (emissions roughly double over the 21st century).
The difference is scaled in mm of rain per day, knowing that 0,5 mm/day ≈ 180 mm/year, that is one fourth to one fith of the annual total for most mid-latitudes. Regions are stippled where at least 80% of models agree on the sign of the mean change.
Source : IPCC, 4th assessment report, 2007
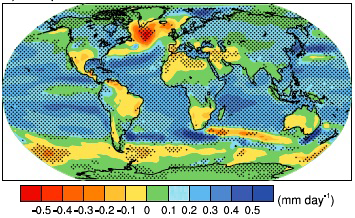
Multimodel ensemble of the regional evaporation change for the 2080-2099 period compared to the average over 1980-1999, with the A1B emission scenario (emissions roughly double over the 21st century).
The difference is scaled in “equivalent mm of rain per day”, knowing that 0,5 mm/day ≈ 180 mm/year, that is one fourth to one fith of the annual total for most mid-latitudes. Regions are stippled where at least 80% of models agree on the sign of the mean change.
Be careful ! green and blue zones mean that evaporation increases (and thus means a drying if everything else remains unchanged).
Source : IPCC, 4th Assessment report, 2007
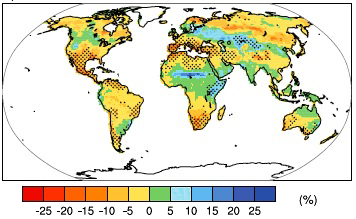
Multimodel ensemble of the regional soil moisture change for the 2080-2099 period compared to the average over 1980-1999, with the A1B emission scenario (emissions roughly double over the 21st century).
Regions are stippled where at least 80% of models agree on the sign of the mean change. A dryer soil is generally not good news for the local biomass. Note that even some places where precipitations increase might end up with a dryer soil (part of Northern Europe, Canada, part of Siberia).
Source : IPCC, 4th Assessment report, 2007
-
- he weather might have become too hot: in the mid-latitudes, vernalization (the fact to be exposed to low temperatures during the winter) is indispensable to many plants to be able to produce fruits (and seeds, of course), and winter is also very useful to many plants to get rid of pests, killed by the cold, and that proliferate otherwise.
- the weather might have become too rich in extreme phenomena, that physically destruct some plants, can degrade the soil, or bring elements that prevent vegetation from growing properly, etc.
A climate change can increase the competition of other species. For example, conditions might become particularly favourables for micro-organisms causing diseases (fungii, microbes…) to plants or animals, or for destructive insects (fancy locust clouds in the fields near Dusseldorf ?),
A climate change can make the context propitious to human damages, particularly the setting of fires which is difficult to avoid in case of drought (and let’s not forget that most of the earth is populated !),
A climate change can more genrally destabilize the balance of an ecosystem, what can lower its biodiversity or, in the worst cases, kill it. During the ice ages, with a world average temperature of “just” 5 °C lower than today, the ecosystems that we know in Europe were not present in the middle latitudes. It is difficult to say what would remain of present ecosystems on a planet that would “warm” by 5 or 6 °C in a century, but in many regions of the world it might mean a big shock.
The vulnerability of agriculture
Agriculture is a particular type of land use, hence everything mentionned above applies, but in this precise case man can attenuate certain climatic disorders (it is possible to partly remediate to drought by irrigation, at least as long as it rains not too far from the place to irrigate, to cold by greenhouse farming, etc).
we have to take something else into account: for a vast mojority of crops, only part of the plant is of high intesrest: fruits or seeds (cereals, fruits, even tomatoes or eggplants !), leaves (cabbage, salad…), tige (sugar cane, or… trees), roots (bettroots, carrots…), tubercules (potatoes), flowers (cauliflowers, artichokes…), etc. This means that tthe question of the adaptation must be cut in two:
- how the whole plant reacts to the climate change induced,
- how this reactions is “spread” among tige, leaves, fruits, roots, etc, and whether the overall result for the part which is really desired can be negative while photosynthesis nevertheless increased. For example enhanced leave growth can lead to a decrease of fruit production.
And at last a plant reacts both to a climate change and a CO2 concentration change. Taking all the interactions into account is not that simple ! Agronomists, however, have tried to figure out what could happen, which is summarized below for the major cereals.
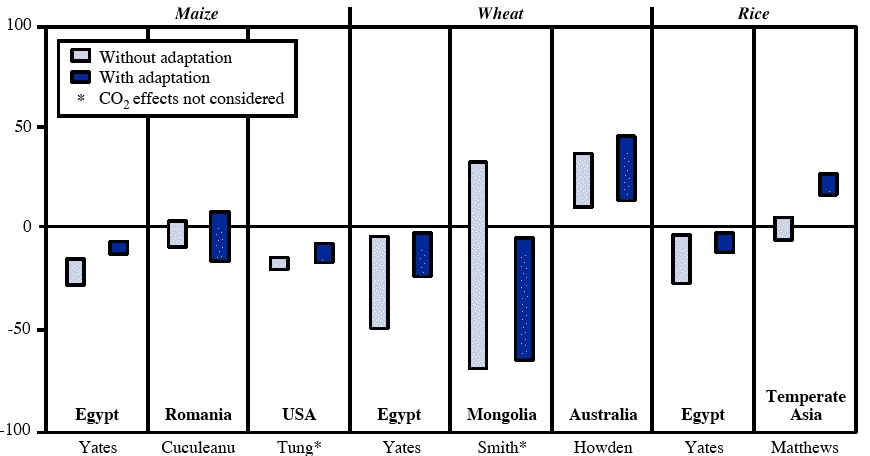
Percent change in the yield in 2100 compared to today for the three main cereals, and various zones. The bracket reflects the influence of the emission scenario chosen. “With adaptation” means that sowing and cropping dates become adapted to the new conditions, “Without adaptation” that it is not the case.
Results show a large sensibility to the emission scenario, that is to the eventual climate change.
Source : Impacts, Adaptation and Vulnerability”, IPCC, 2001
But a number of factors are not – or poorly – accounted for in simulations:
- the possible spreading of new or existing pests (insects, fungii, viruses…),
- competition between species, particularly with adventices (that we call “weeds”when gardening),
- the qualitative change of a given part of the plant (sugar content, size of the grain, etc).
- a possible increase of climate variability.
These results therefore remain indicative, and here as always the main risk factors lie in what it is not possible to evaluate today !
Agriculture has an additional weakness compared to “natural” ecosystems : in developped countries, it has become highly specialized, which means that, based on a small number or varieties, it has high performances in a narrow gap of climatic conditions, but out of this gap the output decreases quickly. Agriculture is therefore particularly vulnerable in case of a strong variability increase, or in the case of the apparition of new pests well suited to a given plant.
Suppose we observe what is really happening ?
It has now been several decades since the average temperature has begun to rise in an “abnormal” way. It was therefore legitimate to investigate whether this evolution already had had a discernable impact on the world food production. The results shown below pertain to the 4 major agricultural commodities in the world (maïze, wheat, rice, soy), that account – directely or through animal feeding – for 70% of the food intake of humanity. Indeed, it seems that the climate change that happened between 1980 and 2008 has already induced a significant decrease of the yield for two of them.
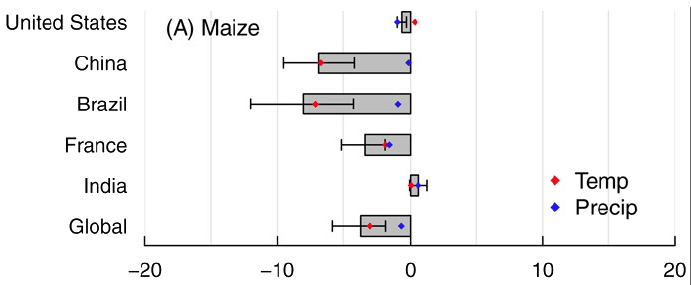
Reconstruction, for the years 1980 – 2008, of the impact of the temperature change (red) and the precipitation change (blue) on the yield of maïze, for several regions in the world and the world as a whole. The full bar gives the median value for the combined effet of temperature and precipitation change, and the thin line gives the uncertainty range, that derives from the method applied.
The said method consists in comparing, for the time interval, the effective production (that can be measured) with what it would have been in a “constant climate”. The latter is calculated using crop models, that are themselves based on correlations between productions and climate parameters (the article does not specify how agronomic progress is accounted for). This calculation is also done with “constant CO2”, which means that the fertilizing effect of the surplus of CO2 in the air (plants have “more to eat”) is deducted from the actual variation of the yields. As the fertilizing effect of the rise of the CO2 concentration in the air results in a couple percent increase of the yield, the actual change in the yield in the world is close to zero.
But when excluding the direct biological effect of a rising CO2 atmospheric concentration, the yield of maïze crops in the world have decreased by 4%± 2% in the world, most of this change resulting from the temperature increase (NB: this study implicitely considers that precipitation change and temperature change are two independant variables, which is debatable ! but discussing this point does not change the global result). USA are not much impacted, but China and Brasil much more.
Source : Climate Trends and Global Crop Production Since 1980, Lobell et al., Science, May 2011.
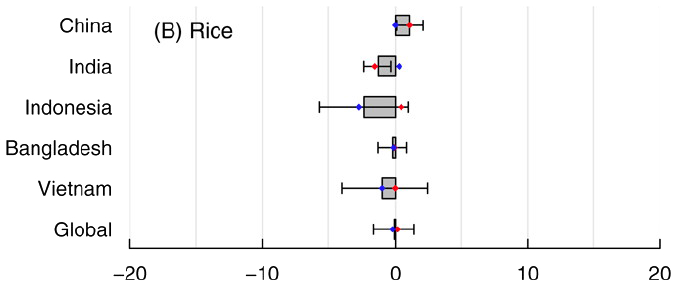
Same as above for rice.
The average change in the world is nil, only India having a slow decrease (0,5 to 2,5%). For Indonesia, the error bar crosses the origin axis, and in such a case there is no conclusion on the sign of the evolution.
Source : Climate Trends and Global Crop Production Since 1980, Lobell et al., Science, May 2011.
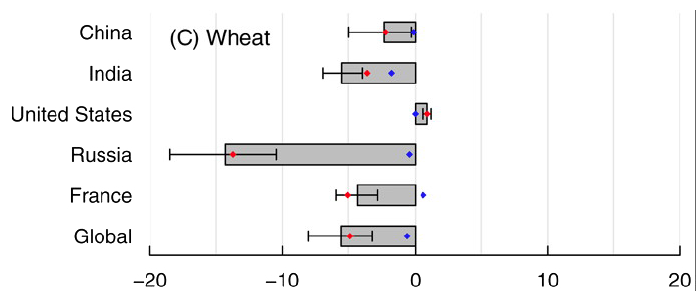
Same as above for wheat.
The net effect of climate change, excluding the CO2 biological effect, is a 5%±2% decrease of the yield in the world. It is however far more significant in Russia, and that calculation was done before the sharp drop of the 2010 crop in that country, which might not remain a significant exporter for very long.
Source : Climate Trends and Global Crop Production Since 1980, Lobell et al., Science, May 2011.
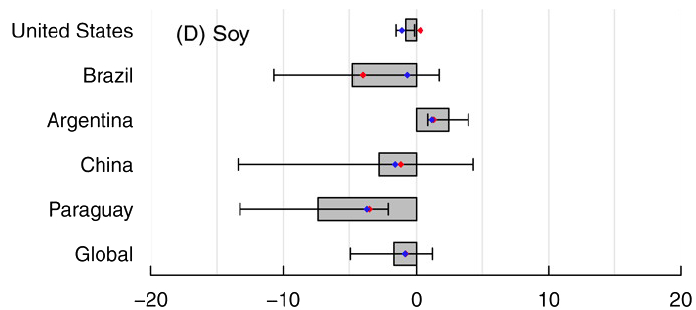
Same as above for soy.
As the error bar crosses the origin axis for the world, there is no definite conclusion regarding the trend. It is interesting to note that Argentina seems to have benefited from an increase in the yield, when Paraguay, a neighbor country, is the only one with a confirmed decrease.
Source : Climate Trends and Global Crop Production Since 1980, Lobell et al., Science, May 2011.
Vulnerability of freshwater ecosystems
As seen above, climate change won’t be restricted to a temperature change, and precipitations will also change. This can harm aquatic ecosystems.
- These ecosystems and the fish populations might suffer from a succession happening too rapidly of high and low waters, or of excessive water temperature increases,
- the changes in freshwater ecosystems might in return have an impact on the avaiability of freshwater.
A short conclusion…
It seems pretty unlikely, given what a couple degrees on the average temperature of the earth represent, that 90% of ecosystems would “skip through” with no harm in case of a significant temperature increase. This being said, trying to be precise on the localization and the nature of possible major changes still remains a risky business…
To know more (for confirmed readers): download (PDF format), the summary for policymakers of the working group 2 of the IPCC: The regional impacts of Climate Change, an assment of vulnerability.