It is quite frequent to mix up weather and climate, that is to consider that a 3 °C increase of the planetary average will mean +3°C in Paris or in Vladivostok, +3°C winter and summer, night or day, in short that this increase will be regular and homogeneous, so that adaptation will be easy. However, if we refer to the past, it is the opposite which is very probable : the change will not be the same everywhere, will be heterogeneous and have multiple threshold effects.
For example, during the last ice ages, the average near ground temperature of the air was 4 to 5 °C lower than today (for the whole world), but in France it was 10 °C lower than today, above Greenland 20°C lower than today, while the tropics experienced small changes compared to the present situation.
If we trust the simulations for the future, what there is no reason not to do for the main conclusions, it is equally improbable that the temperature evolves eveywhere the same way.

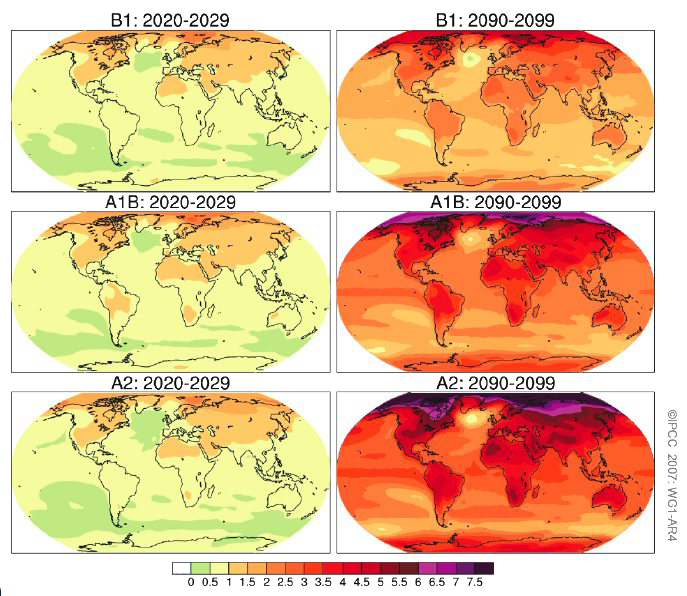
The above maps represent, for three different scenarios (B1, A1B et A2 ; that is in rough terms emissions that remain stable, that double, or that quadruple), the average temperature increase compared to the 1980-1999 mean. On the left the increase is for the 2020-2029 decade, and on the right for the 2090-2099 decade. 6 to 8 models have been used and the results are averaged
Major observations include :
- For the 2020-2029 decade the case is settled : the regional temperature changes are scenario-independant, which means that the emissions that will take place between today and 2020 will have very little influence on the situation taking place in 2020-2029. What we will do during the next 20 years will mostly benefit to what will happen after 2030,
- temperatures rise faster over the continents than over the oceans (because of the thermal intertia of water and because of the thermohaline circulation, that “burries” part of the heat in the deeper ocean),
- the temperature rise is particularly pronounced near the North Pole, because of various factors or feedbacks (sea-ice melting, increased proportion of continents in the Northern Hemisphere, and increased efficiency of the greenhouse effect near the Poles in general terms),
- The Northern Atlantic heats less than the rest of the Arctic region, as a result of a weakening overturning,
- even with emissions that remain constant throughout the 21st century (B1 scenario), mid-latitude occidental countries undergo a 3 °C temperature increase, which is major already.
Source: IPCC, Summary for Policymakers of the 4th assessment report (working group 1), 2007
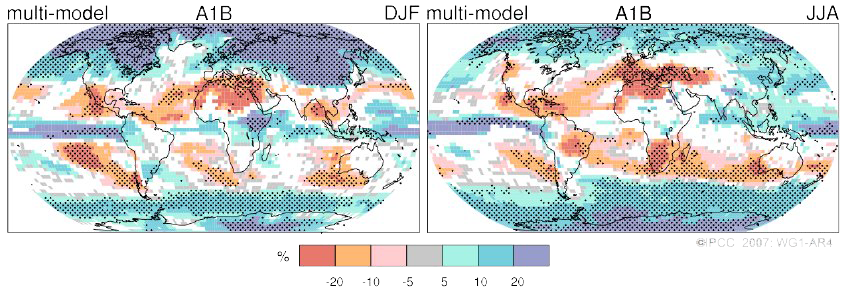
What is true for temperatures is also true for precipitations : the global average will be unevenly dispatched depending on the region of the world.

The above figure shows the regional evolution for the annual mean for precipitations.
Each box is divided in four squares.
The two squares on the left represent the evolution in 2100 compared to today with the A2 reference scenario. The two squares on the right give the evolution with the B2 reference scenario.
Then the two upper square give the evolution in winter (DJF stands for December – January – February) and the lower squares give the evolution in summer (JJA = June – July – August). This means that the square up and right of each box gives the regional evolution in winter and for the B2 scenario.
The legend must be read as follows : “large increase” means that at least 9 models (out of 15 tested) find an increase in the average regional precipitations of more than 20% compared to today. If 9 models at least find a change between 5 and 20% it is a “small increase”, if the consensus is on a change between -5% and +5% it is “no change”, then if the consensus is on a decrease between 5% and 20% it is a “small decrease”, and over 20% for at least 9 models it will be “large decrease”.
If the results yielded by the 15 models are not consistent (i. e. 3 find a large increase, 3 a large decrease, 2 no change, 2 a small decrease, etc) then the box is labelled “inconsistent sign”.
It is easy to notice that evolutions may vary a lot depending on the season, for a same scenario. For example the consensus, for the mediterranean region, is no change for winter, but a large decrease for summer (meaning more droughts).
Source : IPCC, 2001
In conclusion, the expression “global warming”, acceptable on a broad basis, will not be applied evenly to every zone in the world and every season, far from it.